US PROPANE—FOURTH-QUARTER 2007-FIRST QUARTER 2008: Improved US production blunts cold weather effects
Winter 2007-08 in the US was colder than any winter since 2002-03 and total heating degree days in the Northeast and upper Midwest were nearly equal to their 30-year averages. Despite the colder weather, US propane markets experienced no price spikes or distribution system problems. Improvement in domestic production during fourth-quarter 2007 helped offset the impact of colder weather and stronger demand in the residential-commercial sector of the US retail propane market.
Feedstock demand for propane during first-quarter 2008 was also somewhat weaker than expected. This factor also helped offset the impact of the inventory deficit and colder weather.
Feedstock demand
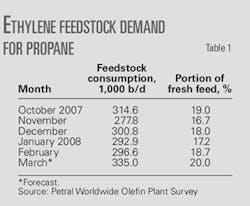
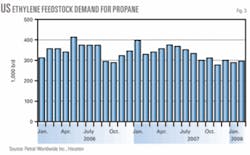
During fourth-quarter 2007, US feedstock demand for propane tracked the typical seasonal pattern and declined by 32,000 b/d vs. consumption during third-quarter 2007. Feedstock demand averaged 298,000 b/d during fourth-quarter 2007 and was 21,000 b/d (1.9 million bbl) lower than during fourth-quarter 2006. Propane’s share of fresh feed averaged 18% during fourth-quarter 2007 vs. 19.6% during third-quarter 2007. Propane’s share of fresh feed during fourth-quarter 2007 was also 1% lower than the average for 2004-06.
Contrary to typical seasonal patterns, however, feedstock demand for propane remained weak in January and February 2008, averaging 295,000 b/d. Propane’s share of fresh feed remained at 18% during January-February 2008.
The year-to-year decline in feedstock demand totaled 4.4 million bbl during first-quarter 2008 and 6.4 million bbl for the full winter heating season. The persistent weakness in feedstock demand during the winter heating season offset about 50% of the year-to-year inventory deficit at the beginning of the winter heating season.
The emerging economic recession has already affected housing starts and consumer confidence fell sharply during first-quarter 2008. The downturn in housing and consumer spending is likely to reduce demand for ethylene during 2008. Ethylene producers will operate at 85-88% of capacity and total demand for fresh feed will average 1.65-1.70 million b/d.
Until March, ethylene production had been forecast to increase by about 1 billion lb compared with output during 2007. Feedstock demand for propane will reach 340,000-350,000 b/d during second and third-quarter 2008 and propane’s share of fresh feed will average 20-21%.
Fig. 1 illustrates historic trends in ethylene feedstock demand for propane.
Retail demand
Winter 2007-08 was colder than the previous winter in every month except February and degree day totals were almost equal to the 30-year average. For November through March, total heating degree days in the Northeast-Middle Atlantic region were 6.5% higher than in 2006-07 but were 3% below the 30-year average and 1% below the 10-year average. In the upper Midwest during November through March, heating degree days were 7.3% higher than in 2006-07, 0.4% higher than the 30-year average and 6.2% higher than the 10-year average.
Petral estimates that total retail propane sales averaged 835,000-845,000 b/d in fourth-quarter 2007, or 45,000-55,000 b/d higher than in fourth-quarter 2006. We estimate that total retail propane sales increased to 1.18-1.20 million b/d in first-quarter 2008, or 40,000-60,000 b/d higher than in first-quarter 2007.
Total demand during the winter heating season totaled 185 million bbl, or about 10.5 million bbl more than during the previous winter. Estimates for retail demand during the winter heating season are based on variations in heating degree days vs. the previous year.
Propane supply
Profit margins for propane recovery from gas processing plants were at record high levels in all producing regions during fourth-quarter 2007. Although natural gas prices (and hence recovery costs) increased more than propane prices, profit margins during first-quarter 2008 remained strong.
For refineries, propane prices averaged $16-17/MMbtu, or $10-11/MMbtu higher than natural gas prices during fourth-quarter 2007. Refineries had no incentive to burn propane instead of natural gas during the winter heating season. Hence, US propane production during fourth-quarter 2007 represented the industry’s full recovery capability.
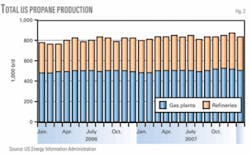
Data from the US Energy Information Administration (EIA) indicate that total domestic production from gas plants and net propane production from refineries averaged 852,000 b/d, or 44,000 b/d (4 million bbl) higher than year-earlier production volumes. Petral estimates domestic production averaged 835,000-845,000 b/d during first-quarter 2008
For winter 2007-08, domestic propane production totaled about 155 million bbl, or 7 million bbl more than during the previous winter heating season.
Gas plants
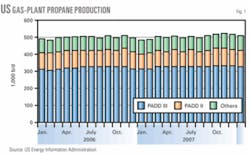
EIA statistics show that gas plant propane production averaged 520,000 b/d for fourth-quarter 2007 and was 16,000 b/d higher than year-earlier volumes. Gas plant production during fourth-quarter 2007 was also 16,000 b/d higher than during third-quarter 2007. The year-to-year increase in gas plant production, while modest, was the equivalent of an additional 1.5 million bbl of inventory.
Petral expects gas plant production to have averaged 510,000-520,000 b/d in first-quarter 2008. EIA reported 509,000 b/d for January 2007. Production is likely to average 510,000-520,000 b/d again in second-quarter 2008.
Fig. 2 shows trends in propane production from gas plants.
Refineries
In fourth-quarter 2007, propane production from refineries (net of propylene for propylene chemicals markets) averaged 332,000 b/d, an increase of 4,000 b/d from net refinery supply in third-quarter 2007 and an increase of 28,000 b/d compared with year-earlier volumes, according to EIA statistics.
The year-to-year increase in refinery propane production was the equivalent of 2.6 million bbl of additional propane in storage on Nov. 1, 2007. The combined year-to-year increase in domestic production totaled 4.1 million bbl and effectively reduced the inventory deficit to about 5 million bbl.
Net refinery propane production during fourth-quarter 2007 was at its lowest level in October 2007 and averaged 317,000 b/d. Production was higher during November and December and averaged 353,000 b/d in December 2007, or 36,000 b/d higher than year-earlier volumes. Net refinery propane production in December 2007 was the highest since December 2004, but refinery production remained 30,000-40,000 b/d below the levels of 1999, 2000, and 2003.
Petral expects propane from refineries to have averaged 325,000-335,000 b/d in first-quarter 2008 and 320,000-330,000 b/d in second and third quarters 2008.
Fig. 3 shows trends in total propane production (gas plants and refineries).
Imports
Data from the US Census Bureau’s Foreign Trade Division show propane imports from Canada increased in fourth-quarter 2007, consistent with the seasonal pattern. Imports from Canada averaged only 139,000 b/d in fourth-quarter 2007, however, or 24,000 b/d lower than year-earlier volumes and 33,000 b/d below the average for 2000-05. Petral estimates that propane imports from Canada increased to 170,000-180,000 b/d in first-quarter 2008.
Consistent with seasonal supply trends, international imports averaged 59,000 b/d during fourth-quarter 2007, as reported by the Foreign Trade Division. International imports were 4,000 b/d more than year-earlier volumes and were 9,000 b/d above the average for fourth quarters of 2003 and 2004. Petral estimates that international propane imports averaged 35,000-45,000 b/d during first-quarter 2008. Eleven of 12 international cargoes moved into the US through East Coast import terminals.
Overall inventory trends
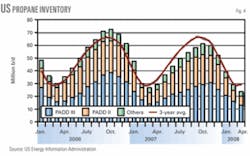
During 2000-06, Nov. 1 normally marked the beginning of the inventory liquidation season for the US. Occasionally, however, propane inventories didn’t reach their seasonal peak until mid to late November. In fourth-quarter 2007, however, propane inventory in primary storage reached its seasonal peak right on schedule, during the last week of October.
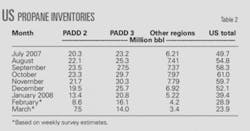
Propane inventory in primary storage reached a peak of 61.0 million bbl at the end of the last week of October, according to the EIA’s inventory statistics in its Petroleum Supply Monthly. For North America, inventories reached a seasonal peak of 73.7 million bbl at the end of October, or 12.4 million bbl lower than the inventory peak in 2006 and 9 million bbl lower than the average peak for 2004-06.
Typically, inventories decline by 12-15 million bbl at the end of December from their seasonal peak. A late flurry of waterborne imports, however, partially offset normal withdrawals of inventory from storage. As a result, at the end of December, inventories were only 8.8 million bbl below the seasonal peak.
During a typical winter, propane markets pull 40-44 million bbl of inventory from primary storage. During 2000-06, withdrawals of propane from primary storage totaled less than 40 million bbl only once (2002) and withdrawals averaged 42.4 million bbl (excluding 2002). With an inventory deficit of 9-12 million bbl at the beginning of the winter heating season, propane marketers reasonably expected inventories to fall to a new record low at the end of March 2008.
This year, total heating degree days (combined for the Northeast, Middle Atlantic, and Upper Midwest) for the winter were almost equal to the 30-year average. The combination, however, of weak feedstock demand November-February and increased domestic production helped offset stronger retail demand. As a result, the cumulative withdrawal from primary storage totaled about 38.0-40.0 million bbl, based on EIA’s weekly inventory reports. Inventory in primary storage in the US declined to a minimum of 23.0-24.0 million bbl at the end of March 2008.
Purity propane in primary inventory in Canada totaled 10.1 million bbl on Sept. 1, 2007, or 1.4 million bbl less than year-earlier volumes but equal to the 5-year average. Based on statistics from Canada’s National Energy Board, companies withdrew 7.5-8.0 million bbl of propane from primary storage during the winter heating season and pulled inventories of purity propane to a seasonal low of 2.0-2.4 million bbl at the end of March 2008. Purity propane inventories in Canada were 0.8-1.0 million bbl higher than year-earlier levels at the end of March.
Fig. 4 shows trends in propane inventory.
Regional inventory trends
Propane inventory in primary storage in Petroleum Administration for Defense District (PADD) II peaked during the first week of October and totaled 23.6 million bbl or about 0.4 million bbl below the average for 2002-06. By the end of January 2008, inventory in primary storage in PADD II declined to 13.4 million bbl and was 2.4 million bbl lower than the 5-year average.
(PADD II consists of Illinois, Indiana, Iowa, Kansas, Kentucky, Michigan, Minnesota, Missouri, Nebraska, North Dakota, South Dakota, Ohio, Oklahoma, Tennessee, and Wisconsin.)
By the end of February 2008, however, EIA’s weekly report showed that inventories in PADD II declined to 8.0-8.5 million bbl, or about 3 million bbl below the 5-year average. Inventories in PADD II continued to decline, falling to a seasonal minimum of 7.5-8.0 million bbl in late March 2008 and were 3.0-3.5 million bbl below average.
Propane inventory in primary storage in PADD III (Alabama, Arkansas, Louisiana, Mississippi, New Mexico, and Texas) reached its peak at the end of November 2007 (about 2 months later than in PADD II) and totaled 31.1 million bbl. Inventory in PADD III was about 3.1 million bbl below the 5-year average.
By the end of January 2008, inventory in primary storage in PADD II declined to only 20.8 million bbl and was equal to the 5-year average. Withdrawals of inventory remained at typical levels during February and March, and inventories fell to a seasonal low of 12.8-13.2 million bbl at the end of March 2008.
At this level, inventories in PADD III were about 2.0 million bbl below the 5-year average.
Pricing, economics
In most market situations, trends in crude oil prices and ethylene feedstock-parity values are the dominant influences on propane prices. Winter 2007-08 was no exceptionuntil February 2008.
At the beginning of the heating season, propane prices in Mont Belvieu averaged 143.1¢/gal in October 2007 and were 20% higher than the July average of 119.1¢/gal. During the period of rising spot prices, propane’s ratio vs. West Texas Intermediate increased to 70.0% in October 2007 vs. 67.5% in July 2007.
These comparisons indicate that emerging concerns about propane inventories for the winter heating season added to the general increase in WTI prices during third-quarter 2007.
WTI prices continued to increase during November and December 2007. Propane prices kept pace with rising crude oil prices and increased to 156¢/gal in November but slipped to 153.2¢/gal in December. During November and December, however, WTI ratios were consistently 69-70%.
Petral notes that US propane inventories declined by only 8.8 million bbl during November and December or 4.4 million bbl less than the average November-December decline in inventories during 2000-06. As the inventory outlook improved, concerns about “running out of propane” diminished sharply. Spot propane prices in Mont Belvieu declined by about 1¢/gal in January 2008 and the WTI ratio slipped to 68%.
In February 2008, however, spot prices declined by 8¢/gal even though WTI prices increased by $2.42/bbl. The propane-WTI ratio fell to 62.7%. The improvement in ethane production during fourth-quarter 2007, combined with a temporary decline in feedstock demand for ethane, prompted a sharp decline in spot ethane prices.
Since ethylene feedstock-value relationships generally resume being the dominant influence on spot propane prices during the first quarter, the collapse in ethane prices in early February precipitated the unexpected decline in propane prices. Although WTI prices jumped to $105/bbl average for March and were as high as $110/bbl during the month, spot prices for propane lagged the crude price rally.
As a result, the WTI ratio weakened further and averaged only 58.7%. The propane-WTI ratio has not been this weak since summer 1991.
Parity values
In view of the ethylene industry’s capability to adjust its consumption of propane within a month or two, propane’s prices vs. its ethylene feedstock value is the true measure of the strength or weakness in spot prices in Mont Belvieu. During fourth-quarter 2007, spot prices in Mont Belvieu averaged 150.8¢/gal, but propane’s feedstock-parity value averaged only 145.8¢/gal. By this measure, propane prices were 5.0¢/gal higher than their average feedstock-parity values.
Furthermore, propane’s premium vs. feedstock-parity values increased by 0.6¢/gal vs. third-quarter 2007. These comparisons are a reliable indication of the relative strength in propane prices during fourth-quarter 2007.
During January 2008, spot prices averaged 150.6¢/gal but feedstock-parity values averaged 152.1¢/gal. The market was working to unwind the relative strength in propane prices to provide the economic incentives needed to support the expected increase in feedstock demand.
In February, however, prices slipped to 142¢/gal but feedstock-parity values slipped to 144.7¢/gal and the economic incentive for propane widened to 2.3¢/gal. Spot prices rallied in March and averaged 147.3¢/gal, but feedstock-parity values jumped to 156¢/gal (primarily due to higher prices for natural gasoline) and the economic incentive for propane widened to 8.7¢/gal.
Spring, summer prices
WTI prices will average $100-110/bbl during second and third quarters 2008. Spot ethane prices, however, are likely to remain relatively weak and continue to undermine propane’s value in at least 40% of the ethylene feedstock market.
Spot propane prices in Mont Belvieu will increase to 155-160¢/gal for second-quarter 2008 and 165-175¢/gal for third-quarter 2008. Feedstock-parity values, however, will increase to 165-170¢/gal during second quarter and 175-185¢/gal in third-quarter 2008. The economic incentive to crack propane will average 7-10¢/gal. The propane/WTI ratio will average 63 65% during second and third-quarter 2008.
The author
Daniel L. Lippe ([email protected]) is president of Petral-Worldwide Inc., Houston. He founded Petral Consulting Co. in 1988 and cofounded Petral Worldwide in 1993. He has expertise in economic analysis of a broad spectrum of petroleum products including crude oil and refined products, natural gas, natural gas liquids, other ethylene feedstocks, and primary petrochemicals. Lippe began his professional career in 1974 with Diamond Shamrock Chemical Co., moved into professional consulting in 1979, and has served petroleum, midstream, and petrochemical industry clients since that time. He holds a BS (1974) in chemical engineering from Texas A&M University and an MBA (1981) from Houston Baptist University. He is an active member of the Gas Processors Association, serving on the NGL Market Information Committee and currently serving as vice-chairman of the committee.
Feedstock demand for propane is an important balancing element for the overall propane market in North America. When colder weather pushes sales and consumption in the retail markets steadily higher, ethylene producers in the Gulf Coast have substantial capability to reduce their consumption and effectively offset some or all of the impact of a colder than normal winter. Historically, most of the seasonal decline in ethylene feedstock demand has occurred during fourth quarter. Frequently, feedstock demand for propane rebounds during first quarter.
Propane’s use as a space-heating fuel in residential-commercial reaches its seasonal peak each year during fourth and first quarters. Residential-commercial propane demand begins to increase during September-October and usually reaches peak demand during December-January.
Consistent with the seasonal increase in retail propane sales, propane imports from Canada typically increase to peak seasonal volumes of 150,000-175,000 b/d during fourth quarter and 170,000-190,000 b/d during first quarter. Additionally, propane imports from outside North America usually decline sharply during fourth quarter. Imports from international sources typically remain at seasonally minimum levels during first quarter.
