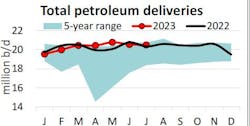
API: US petroleum demand in July highest for the month since 2019
US petroleum demand in July, as measured by total domestic petroleum deliveries, fell 48,000 b/d month-on-month (m/m) to 20.5 million b/d but was at its highest for the month since 2019, according to the latest monthly statistical report from the American Petroleum Institute (API). Year-on-year (y/y), petroleum demand rose by 200,000 b/d.
The m/m decrease recorded for July was the second smallest for the month in 12 years. The monthly net decrease in petroleum demand was a result of decreases in motor gasoline, k-jet fuel, and distillate fuel, which saw July’s transportation fuel consumption falling 376,000 b/d or 2.5% m/m, to its lowest this summer travel season so far. Other oils and residual fuel, which rose m/m by 331,000 b/d and 53,000 b/d respectively, was fully offset by the decline in transportation fuels.
Consumer motor gasoline demand, measured by motor gasoline deliveries, fell 338,000 b/d m/m in July to 8.9 million b/d; a decrease of 3.6%, compared with an average decrease of 0.5% for the June to July period for the past decade.
Distillate deliveries of 3.7 million b/d in July fell by 0.8% m/m and 1.2% y/y to the lowest for any month since August 2020. Combined with declines in June, the fall in the demand for distillates is the largest for any May-July period since 2017. The low demand for distillates reflects downturns in trucking as captured by trendlines. The data showed that the quantity of spot trucks posts decreased by 13.4% m/m and by 5.2% y/y. The building slack capacity is due to a multi-month downturn in manufacturing and freight activity, which is being reflected in falling consumption of diesel and other distillate fuel oils.
Despite falling 1.4% m/m, kerosene-type jet fuel deliveries of 1.7 million b/d were 5.3% higher than July 2022 levels. Jet fuel demand for the month is the third highest for any month since December 2019 and has had 28 consecutive months of year-over-year growth. High-frequency data from Flightradar24 showed that the number of flights went up by 4.8% m/m and remained virtually unchanged y/y. And per reports by the International Air Transport Association (IATA), North American airlines passenger miles rose by 20% year-to-date from the same period in 2022.
Residual fuel oil saw a 28.2% m/m increase in demand of 200,000 b/d in July, the largest increase for the month since 2020. The increase was consistent with reports on a rise in container import volumes.
Deliveries of refinery and petrochemical liquid feedstocks—naphtha, gasoil, and propane/propylene (other oils)—were 5.7 million b/d in July, rising 6.1% m/m. The demand performance for other oils continues to exceed expectations despite uncertain macroeconomic conditions. The increases are likely reflected in market improvements in the manufacturing sector.
US oil production
US crude oil production of 12.7 million b/d in July rose by 245,000 b/d from June to its highest for the month on record and 11.3% above its 5-year average. It was also the second largest volume on record for any month since March 2020.
Compared with July 2022, crude oil production was up by 859,000 b/d. Improved efficiency levels enabled the growth witnessed in crude oil production, even as the day-weighted average total rig count fell 2.1% m/m (15 rigs) to 671 rigs in July. On the other hand, the day-weighted average of natural gas-directed drilling increased by 0.9% m/m (11 rigs), per Baker Hughes.
NGL production of 6.3 million b/d in July rose 61,000 b/d m/m to its highest for the month on record since 1973, partially offsetting the 131,000 b/d decline in June. Production also rose by 162,000 b/d y/y.
Trade, refining
US petroleum exports of 10.1 million b/d, including 4 million b/d of crude oil and 6.1 million b/d of refined products, in July fell by 227,000 b/d m/m from June. At the same time, US petroleum imports fell by 1.2% m/m in July—making it the lowest volume for the month since 2020. Product imports fell 3.2% m/m. Petroleum net exports (1.6 million b/d) contracted 700,000 b/d y/y.
In July, US refinery throughput, measured by gross inputs into crude distillation units, climbed to 17.1 million b/d by processing an extra 206,000 b/d m/m. This implied a capacity utilization rate of 93.6%.
Inventories
US crude oil inventories ended July at 443.8 million bbl, a decrease of 2.2% m/m from June and 4.6% y/y from July 2022. This was the lowest inventory level for the year. US motor gasoline inventories of 217.4 million bbl in July fell 4.9 million bbl y/y to the lowest for the month since 2012. Stocks remain below their historical 5-year average by 7.6%. In terms of days of supply, motor gasoline inventories ended July with approximately 24 days, per the US Energy Information Administration.
US distillate inventories of 116.8 million bbl in July rose 2.3 million bbl m/m and 4.3 million bbl y/y. The monthly increase placed inventories 16.4% below their historical 5-year average. In terms of days of supply, distillate inventories ended July with about 32 days.
