Oil market tightness may continue
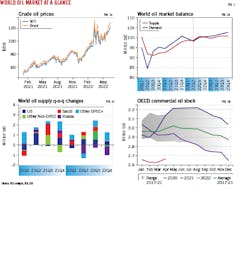
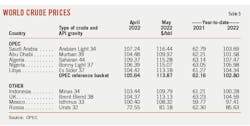
Brent prices climbed above $120/bbl amid the Russian invasion of Ukraine and low oil inventories. Sanctions on Russia by the European Union (EU) and G7, including a nearly complete halt to oil imports from the country, will accelerate the redirection of trade flows and curb Russian oil production. Nonetheless, a steady rise in production in other regions, coupled with slower demand growth, is expected to ward off severe supply shortages in the near term.
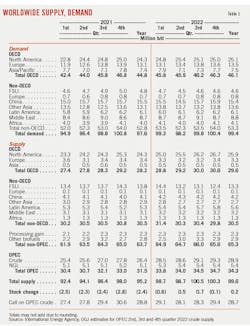
Global oil demand averaged 98.8 million b/d in first-half 2022, compared to 95.7 million b/d in first-half 2021, and 100 million b/d for the same period in 2019, according to estimates from the International Energy Agency (IEA). For 2022, global oil demand is expected to average 99.4 million b/d, compared to 100.4 million b/d in 2019.
The impact of COVID-19 on global oil demand is gradually diminishing. Oil use, especially in the developed countries, continues to recover with eased public health restrictions. Continued expansion of petrochemical capacity has also boosted LPG demand. However, demand growth may lose steam as the economy slows and high inflation hits. Rising inflation and slowing growth has raised concerns that the global economy is entering a period of stagflation. Moreover, stringent Chinese lockdowns under a zero-COVID policy are exacerbating the loss of the demand growth momentum. The country is on track for the first drop in oil demand growth this century.
The marginal increase in crude oil supply mainly comes from increased production by the US and OPEC+ and the release of reserves by IEA members. Despite the increase in crude oil supply, the fundamentals of tight global crude oil supply may persist, especially as tough sanctions force Russia to shut more wells and some producers encounter capacity constraints. In the case of China’s oil consumption recovery, market deficit may be inevitable.
Meantime, the tightness in product markets is intensifying, given limited spare capacity in the global refining system and reduced exports of Russian petroleum products. Global diesel and gasoline markets are witnessing blowout crack spreads.
World economy
Amid the war in Ukraine, surging inflation, and rising interest rates, global economic growth is expected to slump in 2022.
The World Bank lowered its global economic growth forecast significantly in its June issue Global Economic Prospects. The bank now expects global economic growth to slow rapidly to 2.9% in 2022 from 5.7% in 2021, well below the 4.1% expected in January.
“Russia’s invasion of Ukraine has not only precipitated a humanitarian catastrophe, but also resulted in a deep regional slowdown and substantial negative global spillovers. These spillovers are magnifying preexisting strains from the pandemic, such as bottlenecks in global supply chains and significant increases in the price of many commodities,” the World Bank said in the report.
The US inflation rate hit a high of 8.6% in May, up from 8.3% in April. The University of Michigan’s consumer sentiment index fell to 50.1 in early June from readings of 58.4 in May and 65.2 in April. At the time of this writing, the June reading was reaching the index’s lowest recorded value since 1952. The World Bank forecast US growth to slow to 2.5% in 2022, 1.2 percentage points below previous projections, reflecting sharply higher energy prices, tighter financial conditions, and additional supply disruptions.
In response to high inflation, central banks are tightening monetary policy. The Federal Reserve ended taper in March, began raising interest rates, and as of this writing, has raised interest rates by 150 basis points. A rate hike by the US Federal Reserve could boost the US dollar index, which typically has a negative correlation with crude oil prices.
Since second-quarter 2022, developed economies such as Europe and the US, as well as emerging markets in Southeast Asia, have accelerated the unblocking process. Latest guidelines from the US Centers for Disease Control and Prevention (CDC) remove all COVID testing requirements for incoming flights.
However, China’s epidemic control has become more stringent. The downward pressure on China’s economy and oil demand is increasing, although the lockdowns recently showed signs of easing. China is expected to grow 4.3% in 2022 and 5.2% in 2023, down from 8.1% in 2021. The forecast for this year has been downgraded 0.8 percentage point, reflecting larger-than-expected damage from COVID-19 and related lockdowns.
Euro area growth is projected to slow to 2.5% in 2022, down by 1.7 percentage points from an earlier forecast, due to higher energy prices, continued supply disruptions, and tighter monetary policy. The European Central Bank planned to raise interest rates the first time in a decade. The S&P Global Eurozone Manufacturing PMI fell to 54.6 in May, an 18-month low.
Russian output is forecast to contract by 8.9% in 2022, reflecting a sharp fall in domestic demand and declining exports.
World oil demand
Oil demand is expected to come under pressure with slowing economic growth and surging consumer prices. However, in the short-term, oil demand remains supported by the world’s accelerating emergence from the COVID-19 pandemic.
The IEA’s world oil demand forecast for 2022 now calls for a year-on-year expansion of 1.83 million b/d. This compares to an initial forecast of growth of 3.3 million b/d in January and compares to last year’s growth of 5.68 million b/d.
For the first two quarters of 2022, global oil demand is estimated to have grown by 3.1 million b/d year-on-year. For the second half of the year, year-on-year demand growth will be mostly tempered, averaging 300,000 b/d, due to higher prices, a weaker economic outlook, and a higher baseline in second-half 2021.
Global air traffic continues to pick up. Before the global pandemic, jet fuel accounted for about 8% of global oil demand. Although 2022 was off to a slower start, global air traffic has improved significantly. However, the recovery in global jet fuel demand has been dragged down by the crises in China and Russia. Sanctions on Russia are starting to weigh on its domestic economy. The most severe impact so far has been on jets/kerosene as the number of commercial flights fell sharply despite a sharp increase in military demand. In China, air traffic fell even more sharply, to around 3,000 flights a day in April from nearly 11,000 flights a day in February. Still, the numbers of passengers and flights have continued to increase elsewhere in the world, especially in Europe and North America. Global jet/kerosene demand is still expected to grow steadily throughout 2022 (+16.8%), reaching 6 million b/d for 2022, but would still lag 2019 levels by nearly 2 million b/d.
Surging consumer prices are already moderating road fuel use. Traffic data for April and May showed reductions in road fuel demand in the US, UK, and Germany. According to IEA’s forecasts, global motor gasoline demand and diesel oil demand will increase 463,000 b/d and 287,000 b/d this year, down from growth levels of 2 million b/d and 1.3 million b/d last year, respectively. The 2022 annual average will be 26.18 million b/d for gasoline and 28 million b/d for diesel, slightly less than 26.64 million b/d and 28.23 million b/d seen in 2019.
Demand for LPG and ethane will grow 4% this year with expansion of petrochemical capacity in Asia and North America.
Global oil demand growth this year is mainly driven by OECD countries. According to IEA’s forecasts, OECD consumption for 2022 is to average 46.1 million b/d, a 1.3 million b/d year-on-year increase, and 1.65 million b/d below 2019. Total non-OECD 2022 demand is pegged at 53.3 million b/d, 510,000 b/d higher year-on-year, and 690,000 b/d above 2019.
Demand in OECD Americas will increase 800,000 b/d in 2022. Soaring jet fuel and other fuel oil demand, as well as and strong LPG demand are compensating for slower road fuel demand.
In OECD Europe, fuel switching from natural gas to oil slows with recent stabilization of gas prices and sharp increases in middle distillate costs, which eases oil demand. European embargo of Russian crude and products reduces throughput for European refineries as they look to replace Russian crude, and reduces Russian refinery output/exports, adding further tightness. Nevertheless, the recovery of jet fuel usage in Europe remains strong.
Demand growth in OECD Asia is expected to slow in second-half 2022 as a bleak economic outlook and record prices cap demand.
After hitting record levels in first-quarter 2022, non-OECD oil demand has cooled due to the impact of China’s harsh COVID-19 lockdown measures, international sanctions on Russia, and rising oil prices.
China’s lockdown is causing widespread disruption to personal mobility and economic activity across different industries. The zero-COVID lockdowns squashed consumer-driven demand and disrupted supply chains and manufacturing, hurting oil demand. Total Chinese oil use is expected to decline by 1.2 million b/d year-on-year in second-quarter 2022, compared with a year-on-year increase of 520,000 b/d in first-quarter 2022. For full-year 2022, China oil demand is expected to decline by 100,000 b/d, the first decline in this century.
Oil demand in Russia is forecast to drop by 140,000 b/d (-4%) with international isolation and weak domestic economy. Deliveries in India, Latin America, and the Middle East will still see positive trends in 2022. Since the outbreak of the Russia-Ukraine war, India has increased its oil imports from Russia. Russia exported 24 million bbl of crude oil to India in May, much higher than the 7.2 million bbl in April, while the scheduled supply in June was 28 million bbl.
Global oil supply
Tightness in global crude supplies is likely to persist despite the increase in global crude supplies, especially as Russia shut more wells and some producers encounter capacity constraints. Since the fall in oil prices in 2014, the lack of global upstream capital expenditure has led to bottlenecks in the production capacity of traditional oil fields, making it difficult to achieve rapid production increases.
The OPEC+ group, which provides a major marginal supply in the short term, had until recently been strictly increasing production target by 432,000 b/d per month. During the 29th Ministerial Meeting, OPEC+ finally decided to advance the planned overall production adjustment for the month of September and redistribute equally the 432,000 b/d production increase over the months of July and August 2022. Therefore, July and August production targets have been adjusted upward by 648,000 b/d.
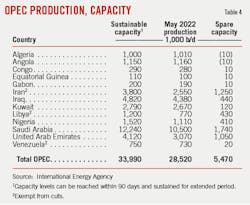
Although OPEC+ agreed to increase the rate of production increase, only Saudi Arabia and the United Arab Emirates (UAE) have idle production capacity of more than 1 million b/d. Most other members, e.g. Nigeria and Angola, are still struggling to meet quotas due to capacity constraints and ongoing technical and operational issues caused by underinvestment. The shortfall between the bloc’s supply versus official output targets widened to around 2.8 million b/d in May.
Oil production in Libya remains constrained by ongoing civil unrest. Downside risks to supply are increasing as export disruptions intensify. Iran’s crude oil supply held at 2.55 million b/d this year. Negotiations with the West to revive the 2015 nuclear deal have been on hold since March, as Iran insists that the US remove the Islamic Revolutionary Guard Corps from the US Foreign Terrorist Organization list. The return of Iranian oil to the market faces setbacks.
OGJ forecasts OPEC crude oil production will increase to 28.9 million b/d in 2022. For 2023, OPEC’s crude oil capacity is expected to slip by 40,000 b/d to 33.96 million b/d.
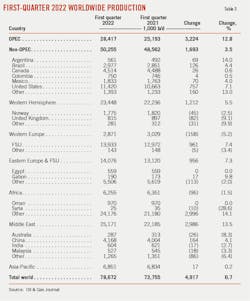
Russia’s crude oil production has declined significantly since its invasion of Ukraine in February, dropping from a high of 10.13 million b/d to 9.1 million b/d in April, which was already lower than the target set by the OPEC+ framework of 10.44 million b/d. Russian oil production is expected to plummet further from July due to sanctions targeting the country’s energy exports, especially given the EU’s recent decision to halt most oil purchases from Russia by yearend. Meanwhile, Russia’s oil exports have been resilient. Although the export data in May fell slightly compared with April, they continued to be strong. China and India are both enthusiastic buyers of Russian crude.
Total OPEC+ production is expected to increase to 51.6 million b/d this year from 49 million b/d last year. Higher OPEC+ flows will come at the expense of the group’s effective spare capacity held mainly by Saudi Arabia and the UAE.
Non-OPEC+ oil supply is projected to average 48.2 million b/d in 2022, a boost of 1.9 million b/d year-on-year. The US is expected to contribute to more than 60% of the non-OPEC+ 2022 gain. Growth will also come from Canada, Brazil, and Guyana, up by 230,000 b/d, 120,000, and 140,000 b/d, respectively. China oil production will increase by 170,000 b/d this year with sizable offshore projects and strong growth in upstream capital expenditure.
Overall, global oil supply is expected to reach 99.6 million b/d, up from 95.2 million b/d a year ago.
OECD inventories
Helped by government stock releases of nearly 1 million b/d during the month, OECD industry stocks rose by 42.5 million bbl in April, according to IEA data. At 2.67 billion bbl, OECD industry stocks were 290.3 million bbl below the 2017-2021 average. Middle distillates and crude oil accounted for 33% and 46% of the deficit versus the average, respectively.
After nearly 2 years of declines totaling 1.15 billion bbl, observed global oil inventories built by 77 million bbl in April. Outside of the OECD, most of the increase in inventories have occurred in China.
US oil demand
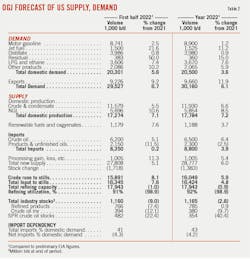
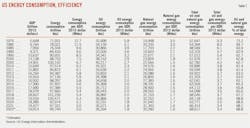
Helped by eased public health restrictions, US oil consumption in first-half 2022 rose 5.61% year-on-year to 20.3 million b/d, according to preliminary data from the US Energy Information Administration (EIA). This compares to 17.78 million b/d in first-half 2020 and 20.4 million b/d in first-half 2019. The strong growth in US oil consumption during the first half was driven by jet fuel, hydrocarbon gas liquids (HGL), and motor gasoline.
OGJ forecasts that total US oil consumption will average 20.5 million b/d in 2022, a growth of 720,000 b/d (3.6%) from the 2021 level, led by rising consumption of jet fuel and HGL. The forecasted 2022 consumption is also compared to 18.18 million b/d in 2020 and 20.54 million b/d in 2019.
In this year’s first half, US motor gasoline demand is estimated to have averaged 8.74 million b/d, up 2.5% year-on-year. However, this level remained below the pre-pandemic level of 9.27 million b/d in first-half 2019.
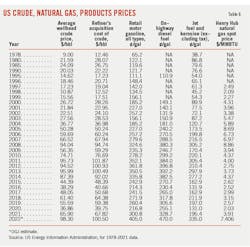
Record high pump prices and more challenging economic conditions could dim growth prospects. OGJ expects US regular gasoline retail prices to average $4.05/gal in 2022, compared to $3.02/gal in 2021, and $2.18/gal in 2020. As the US enters the peak of summer driving, gasoline prices have continued to climb, rising to $5/gal on June 9, surpassing the 2009 high.
OGJ expects that motor gasoline demand in the US will increase by around 100,000 b/d (+1.2%) in 2022, averaging 8.9 million b/d.
Distillate consumption has been less impacted by COVID-19 than gasoline or jet fuel consumption. Estimated US distillate fuel consumption averaged 3.98 million b/d in first-half 2022, compared to 3.95 million b/d in 2021, 3.75 million b/d in 2020, and 4.17 million b/d in 2019.
According to data from the US Bureau of Transportation Statistics, trucking freight in the first 4 months of this year, as measured by the truck tonnage index (seasonally adjusted), indicated an increase of 2.34%. However, April and May data showed that distillate deliveries are slowing. OGJ forecasts that for the entirety of 2022, US distillate demand will average around 3.98 million b/d compared to 4.1 million b/d in 2019.
Since a sharp recovery in second-half 2021, US jet fuel demand has been largely stable around 1.5 million b/d, although about 13% lower than the 2019 level. This is in line with the daily number of commercial flights (via Flightradar24), which has remained roughly around 16% below 2019 levels. OGJ forecasts US jet fuel consumption will increase by 11.2% year-on-year in 2022 to an average of 1.53 million b/d, still below 1.74 million b/d in 2019.
Estimated US consumption of HGL averaged 3.6 million b/d in the first two quarters of 2022, up from 3.36 million b/d in first-half 2021 and 3.1 million b/d in first-half 2020 and first-half 2019. OGJ forecasts US consumption of HGL will climb 7.6% in 2022 to average 3.67 million b/d, supported by increased ethane use as a petrochemical feedstock.
US residual fuel consumption averaged 382,500 b/d in the year’s first half, up 50% from the level a year ago, reflecting increased maritime shipping usage. OGJ forecasts US residual fuel consumption will grow 15% in 2022.
US oil production
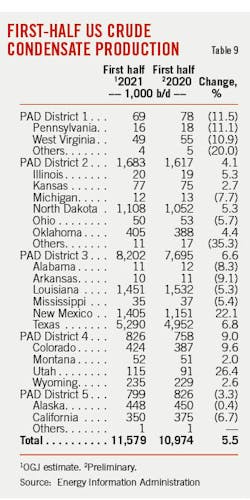
In first-half 2022, the average daily production of crude oil in the US was 11.58 million bbl, a year-on-year increase of 610,000 bbl (+5.51%).
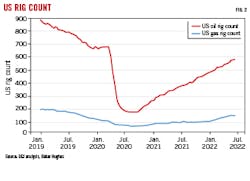
According to rig count data released by Baker Hughes, the number of active US oil rigs was 584 for the week ended June 17, compared to 359 active oil rigs a year ago, and 292 for the same time in 2020. Gains come mostly from the Permian, with growth in onshore oil rigs accounting for more than 50% of the US total so far in 2022.
In the meantime, the inventory of drilled but uncompleted (DUC) wells has been drawn rapidly. DUC wells decreased consecutively from a high of 8,809 in June 2020 to 4,223 in March 2022, according to data from EIA’s Drilling Productivity Reports.
For first-half 2022, Permian basin’s crude oil production averaged 5.02 million b/d, a year-on-year increase of 13.6%. Rig count in the play surpassed 340 in June, up from 237 a year ago. Horizontal drilling permits for new wells in the Permian basin hit an all-time high in March, Rystad Energy said.
After experiencing production losses in 2021, other plays are expected to post modest growth this year. Bakken’s crude oil production was 1.15 million b/d for first-half 2022, an increase of 1.26% compared to the same period a year ago. Eagle Ford’s crude oil production was 1.12 million b/d, a growth of 6.38% year-on-year.
Public companies continue to prioritize increasing margins, repairing balance sheets, and returning cash to shareholders rather than investing in more capacity. Private operators, less focused than their public counterparts on well optimization and environmental objectives, have reacted quickly to the elevated market, increasing activity and output. However, continued strains in oilfield services and supply chains could limit any upside.
In 2021, crude production of the Gulf of Mexico averaged 1.7 million b/d, up 3.3% from a year ago. The Gulf of Mexico is expected to see continued crude production growth in 2022, driven by new projects coming online.
Overall, OGJ forecasts full-year 2022 US crude oil production to average 11.93 million b/d, up 6.6% from 2021 levels. That also compares with 12.28 million b/d in 2019.
OGJ forecasts NGL production at natural gas processing plants will expand to 5.85 million b/d in 2022 from an estimated 5.4 million b/d in 2021, thanks to improved ethane processing efficiency.
Combined, US total domestic oil production in 2022 is expected to grow 7.27% from a year ago to 17.78 million b/d.
US refining
Refining margins for gasoline and diesel products are at or near record highs amid rising prices and low inventory levels, leading to increased refining activity and output. However, the increase in refinery production is dampened by a decline in refining capacity.
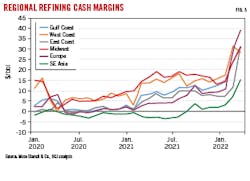
Refining cash margins for the first 5 months of 2022, the latest data available, averaged $24.72/bbl for the Midwest, $26.62/bbl for the West Coast, $23.95/bbl for the Gulf Coast, and $19.71/bbl for the East Coast, according to Muse Stancil & Co. These compared to cash refining margins of $13.95/bbl, $10.88/bbl, $5.78/bbl, and $4.68/bbl, respectively a year ago. For the same period in 2020, these refining margins averaged $8.22/bbl, $7.71/bbl, $4.02/bbl, and $1.18/bbl.
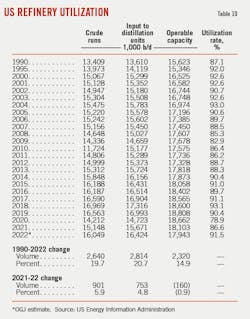
Gross inputs to US petroleum refineries, or refinery runs, averaged 16.35 million b/d in the year’s first half, up 7.63% from the year-ago level. US refinery utilization rates averaged 89.5% in first-quarter 2022 and 93% in the second quarter, reflecting high margins on wholesale products. OGJ expects the US refinery utilization rate to average 92% in second-half 2022, leading to an annual average of 91.5%, which compares with 90.3% in 2019.
While refinery utilization is expected to be at or near the highest level over the past 5 years, refinery operating capacity is about 900,000 b/d lower than yearend 2019, so total refinery product production will not reach its highest level in the past 5 years.
After peaking in 2016, US refining capacity has since fallen by 1.2 million b/d. Two more refineries, totaling 500,000 b/d, are expected to close in 2022 and 2023, but this will be partly offset by a 250,000 b/d expansion at the Beaumont refinery and the addition of a 50,000 b/d plant in North Dakota. Overall, US refining capacity will decline by a net 210,000 b/d in 2022-2023.
US oil trade
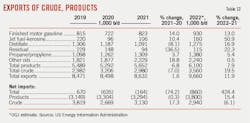
Next exports of US crude oil and petroleum products in the first half of this year were estimated to average 876,000 b/d, up from 121,000 b/d over the first half of last year. The sharp increase in net exports was mainly driven by product net exports. Net exports of petroleum products averaged 3.76 million b/d for first-half 2022, a year-on-year increase of 24%. Crude oil net imports averaged 2.88 million b/d in the first half, largely flat with 2.9 million b/d a year ago.
Exports of crude oil, HGL, finished motor gasoline, and distillate have all increased since the start of 2022, partly due to higher European demand. Over the first half, US exports of crude oil and petroleum products averaged around 9.3 million b/d, a year-on-year growth of over 10%. Based on a 4-week rolling average, US exports reached a record 9.8 million b/d during the week of May 27.
According to EIA data, total US crude exports rose to a recent high of 3.7 million b/d in the week of May 27 from 2.6 million b/d the week of Feb. 18—the week before Russia’s full-scale invasion of Ukraine. As Europe shifts away from importing crude oil from Russia, US exports of crude oil to Europe have increased. According to Kpler data, US crude exports to Europe reached near-record highs, averaging 1.5 million b/d in April and 1.4 million b/d in May.
EIA monthly trade data shows that US crude oil exports in first-quarter 2022 (the latest data available) were around 3.33 million b/d, compared with 2.85 million b/d (+16.6%) in the same period last year. India received 393,666 b/d, accounting for 11.84% of total US crude oil exports. However, this level was down by around 30,000 b/d year-on-year. US crude exports to Singapore averaged nearly 350,000 b/d in first-quarter 2022, up from 97,6000 b/d in first-quarter 2021. Exports volumes to South Korea and Canada both dropped when compared to year-ago levels. Meantime, US crude exports to China averaged 230,000 b/d in first-quarter 2022, down from 332,700 b/d in first-quarter 2021.
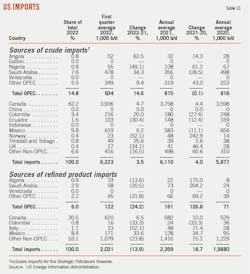
The US imported 6.32 million b/d of crude oil in first-quarter 2022, compared with 5.72 million b/d in the same period last year. Crude oil imports from OPEC members averaged 935,000 b/d, up from 605,000 b/d in first-quarter 2021. US’s crude imports from Saudi Arabia increased to 477,333 b/d from 258,000 b/d in last year’s first quarter. The leading source of US crude imports was still Canada, which supplied 3.93 million b/d, up from 3.76 million b/d in first-quarter 2021.
According to EIA monthly trade data, US petroleum product exports averaged 5.77 million b/d in first-quarter 2022, a year-on-year increase of 11.5%. Mexico was the top destination for US petroleum product exports, receiving 1.12 million b/d, or 19.5% of total US petroleum products exports. Aside from Mexico, US petroleum products exports went mostly to Japan, Canada, and China.
US exported an average of 2.35 million b/d of HGL in first-quarter 2022, an increase of 4.44% over the same period in 2021. Japan received the largest share of US HGL exports at 427,666 b/d, followed by Canada at 259,333 b/d, and China at 246,333 b/d. Record high exports of propane and ethane are the main drivers of record US product exports.
In first-quarter 2022, the US also exported an average of 823,000 b/d of motor gasoline and an average of 1.07 million b/d of distillate, up 11.8% and 22% respectively year-on-year.
During this year’s first quarter, the US imported 2.04 million b/d of petroleum products, down from 2.23 million b/d for the same period a year ago.
US oil stocks
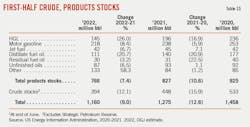
US crude oil inventories excluding the Strategic Petroleum Reserve (SPR) closed out midyear 2022 at 394 million bbl, down from 447 million bbl a year ago.
The amount of crude oil in the SPR stood at 482 million bbl at the end of June, down from 621 million bbl a year ago. The Biden administration announced the largest-ever release of oil from the US SPR in an effort to lower crude prices. According to an official fact sheet at the end of March, the White House will release 1 million b/d from the SPR over a 6-month period, for a total release of about 180 million bbl.
Meantime, with higher product consumption, exports, and lagged refinery production, product stocks at midyear 2022 remained well below their 5-year average.
Total product stocks at midyear 2022 were 766 million bbl compared to 823 million bbl a year ago. Motor gasoline inventories were 223 million bbl at the end of June, compared to 237 million bbl a year ago. Distillate fuel oil stocks moved down to 109 million bbl from 140 million bbl a year ago. Jet fuel inventories were 39 million bbl compared to 44 million bbl a year ago.
US natural gas
Low inventories, lower-than-expected production, continued high demand for US LNG exports, and high gas demand from the power sector are all driving up gas prices.
Natural gas spot price at Henry Hub averaged $6.22/MMbtu over the first half of this year, compared with $3.25/MMbtu over the first half of 2021. For full-year 2022, natural gas prices are expected to reach $7.4/MMbtu, compared with $3.9/MMbtu in 2021, and $2.03/MMbtu in 2020.
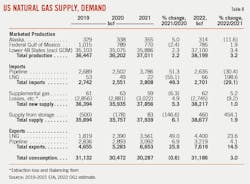
US natural gas consumption averaged 83.12 bcfd in 2021, a year-on-year decrease of 0.21%. Year-to-date through June, US natural gas consumption averaged 89.4 bcfd, up from 85.9 bcfd over the same period a year ago, the latest EIA data shows. For full-year 2022, OGJ forecasts US natural gas consumption will grow 3%, averaging 85.44 bcfd.
Despite high gas prices, strong growth in US natural gas consumption has been supported by rising consumption across all industries. In particular, the limited conversion of natural gas to coal in the power sector has resulted in increased demand for natural gas.
Gas consumption by the power sector in 2021 declined by 2.8% year-on-year to 30.88 bcfd due to relatively high gas prices. However, in the first 6 months of this year, despite record high gas prices, gas consumption by the power sector averaged 29.73 bcfd, up from 28.03 bcfd over the same period a year ago, due to limited gas-to-coal switching. Gas consumption by the power sector is now expected to grow 2.8% in 2022 to 32 bcfd.
Over this year’s first half, industrial natural gas consumption averaged 23.63 bcfd compared to 22.65 bcfd over the same period a year ago thanks to increased manufacturing activities. OGJ forecasts industrial demand for natural gas will rise 1.6% in 2022 to 23 bcfd.
Natural gas consumption in the commercial sector averaged 10.89 bcfd over the first half compared to 10.6 bcfd over the same period a year ago. Natural gas consumption in the residential sector averaged 16.92 bcfd compared to 16.675 bcfd over the same period a year ago.
Over the first half of 2022, US marketed gas production averaged 103.27 bcfd, up from 99.3 bcfd over the same period a year ago. OGJ forecasts US marketed gas production will grow 3.2% to 104.6 bcfd in 2022. The increase in marketed gas production mainly comes from the Lower48 states, especially the Permian basin. According to Baker Hughes, for the week ending June 17, the natural gas rig count was 154, up from a low of 68 in July 2020.
In 2021, US LNG exports increased by 3.2 bcfd, or 49%, from the 2020 level. US LNG exports in 2022 are expected to climb 22.59%, or 12 bcfd.
Europe has become the leading destination for US LNG exports, accounting for 74% of total US LNG exports in the first 4 months of 2022. The US will work with international partners to supply Europe with at least 15 billion cu m (bcm) of LNG in 2022 to help wean the EU off Russian energy supplies, according to a joint statement released by the EU and the US on Mar. 25. US LNG exports in 2023 will continue to increase as new LNG export terminals come online in mid-2022 and become operational throughout 2023.
Natural gas inventories ended May at 1,983 bcf, 351 bcf (15%) below the 5-year average. Below-average storage at the start of this injection season along with a forecast of average storage injections this summer mean that natural gas inventories will be below the 5-year average at the start of the winter heating season.
About the Author
Conglin Xu
Managing Editor-Economics
Conglin Xu, Managing Editor-Economics, covers worldwide oil and gas market developments and macroeconomic factors, conducts analytical economic and financial research, generates estimates and forecasts, and compiles production and reserves statistics for Oil & Gas Journal. She joined OGJ in 2012 as Senior Economics Editor.
Xu holds a PhD in International Economics from the University of California at Santa Cruz. She was a Short-term Consultant at the World Bank and Summer Intern at the International Monetary Fund.
Laura Bell-Hammer
Statistics Editor
Laura Bell-Hammer is the Statistics Editor for Oil & Gas Journal, where she has led the publication’s global data coverage and analytical reporting for more than three decades. She previously served as OGJ’s Survey Editor and had contributed to Oil & Gas Financial Journal before publication ceased in 2017. Before joining OGJ, she developed her industry foundation at Vintage Petroleum in Tulsa. Laura is a graduate of Oklahoma State University with a Bachelor of Science in Business Administration.
