Applying modern portfolio theory in the upstream oil and gas sector
Gary L. cartwright,Devon Energy Corp., Oklahoma City
EDITOR’S NOTE: Modern portfolio theory (MPT) was first defined by Harry Markowitz with his paper, “Portfolio Selection,” which appeared in the 1952 Journal of Finance. While MPT and management began in the 1950s, the practice did not reach the oil and gas industry until 40 years later. In this second of two articles, Gary Cartwright, corporate portfolio advisor for Devon Energy Corp., addresses risk and variance as it applies to oil and gas exploration. Additionally, Cartwright discusses how MPT fits within the field of organizational planning and evaluation.
Oil and gas E&P companies seek to reduce risk or uncertainty in their investment decisions. Every exploration and development investment decision has two questions or two macro risks associated with it: 1) if this prospect is drilled, will it be a dry hole or a producer; and 2) if it is a producer, how big will it be? For most of the history of oil and gas exploration, geologists and other explorationists focused almost exclusively on the first question.
Geologists use their knowledge of depositional events to model where oil and gas traps can be found. Geologists rely on surface and subsurface features, which hint of what traps might lie under ground.
The science of geophysics developed to help gain additional insights into the location and likelihood of subsurface hydrocarbons. Geophysicists utilize the reflection and refraction of sound waves to identify likely oil and gas targets. Initially, the seismic methodology focused on two-dimensional seismic lines shot to augment a geological interpretation.
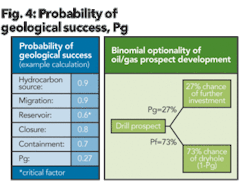
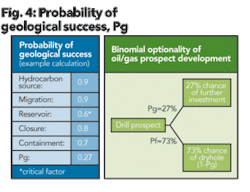
In addition to geologic and geophysical modeling, a hydrocarbon source must be present for the production of oil and gas. To help further quantify the likelihood of geologic success, specialists in a team-oriented approach estimate the various components.
According to Figure 4, the likelihood of migration is estimated at 90%. The probability of closure is estimated at 80% while the probability of containment is estimated at 70%. The reservoir component can seldom be estimated without a flow test of the formation. In Figure 4 these probabilities are multiplied together to arrive at a geologic probability of success of 27%.
The right side of Figure 4 is the binomial representation of the geologic probability of success and the probability of a dry hole. If a dry hole is drilled, then subsequent investments in the oil and gas prospect are not typically incurred. Binomial distributions can be modeled with numerous spreadsheet or other programs to gain insight of how the distribution impacts the economics of a given project.
Lognormality of oil and gas production
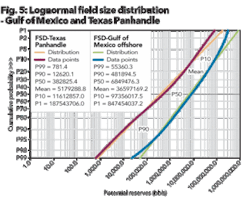
The second source of variance of an oil and gas prospect is within the lognormal distribution of the oil and gas find. Oil and gas production exhibits a lognormal1 distribution regardless of its location in the world. Figure 5 shows the field size distribution of oil and gas fields in two separate areas.
The blue and green lines show the size distribution of oil and gas fields in the offshore Gulf of Mexico. The corresponding box in the upper left hand portion of the graph indicates that the mean field size is 36.6 million bbls of equivalent oil while the P50 value is 6.8 million bbls. (Oil equivalency is based on converting every 6 mcf of gas to one bbl of oil per industry practice.) The P50 value represents the median value of the distribution.
In contrast, the purple and orange lines show the oil and gas field size distribution for the Texas Panhandle. For the Texas Panhandle, the mean value is 5.2 million bbls of oil equivalent, while its P50 value is 382,000 bbls of oil equivalent.
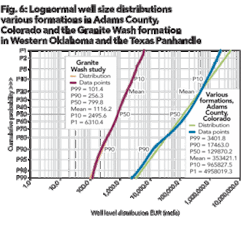
Figure 6 presents similar information, but Figure 6 shows an individual well size distribution rather than a field size distribution. (Note: oil and gas fields are comprised of multiple wells often producing from more than a single formation.)
The blue and green lines in Figure 6 show the distribution for wells producing from the Cleveland formation in the Texas Panhandle. The purple and orange lines show the distribution of wells in western Oklahoma and the Texas Panhandle that produce from the Granite Wash formation. Notice how both distributions plot linearly on a lognormal coordinate system. Thus, regardless of location or formation or whether it is a well or field, these oil and gas accumulations behave in a lognormal fashion.
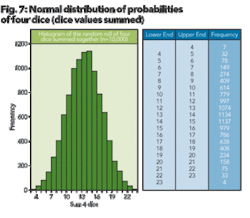
For a better understanding of lognormal behavior,2 let’s try our luck with Figures 7, 8, and 9. Figure 7 illustrates a normal distribution, which occurs if you roll four dice 10,000 times and plot the additive values of each of the rolls. (Note: this example is easily created in Excel using a random number generator confined to select an integer between and including 1 through 6.)
In other words, if on the first roll each of the dice show on their face a value of 1, 3, 5, and 6, then the value of 15 (1 + 3 + 5 + 6 = 15 ) is recorded. After 10,000 rolls, a normal (bell shaped) distribution frequency occurs as shown in Figure 10.
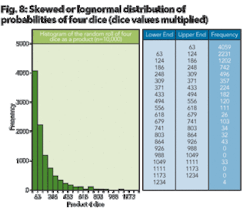
However, if you multiply the value of the four dice faces rather than add the value of the four faces, a different distribution of results is noted. For example, the same roll of 1, 3, 5, and 6 would result in a value of 90 occurs (1 × 3 × 5 × 6 = 90). After rolling the dice 10,000 times, a plot of the values yields a right skew of the distribution.
This is shown in Figure 8. Thus, random variables when added together result in a normal distribution, but random variables multiplied together result in a skewed distribution. However, recall that in order to convert multiplied values to additive values, one need only to take the logarithm of the function:
Given:
Then: log y = log a + log b + log c
Hence, this type of skewed distribution can be normalized by taking the log of the values.
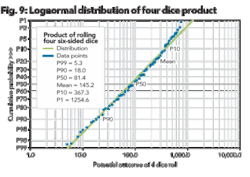
Figure 9 shows the values of Figure 8 plotted on a lognormal probability scale. According to the insert in the upper left hand corner of the graph, the mean value of four randomly rolled dice is 145.2 while the P50 value is 81.4. This is consistent with the other lognormal distributions in that the mean value is greater than the P50 value. This is contrary to normal distributions where the median or P50 value are close to the same value.
So why does field size distribution follow a lognormal pattern? Primarily because oil and gas volumes are…volumes, in other words any volume is the product of its average height, its average width, and its average depth multiplied together. And, as demonstrated by the multiplication of the dice example, distributions formed by the product of random variables are lognormally distributed.
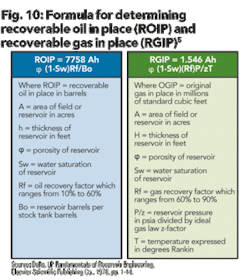
Oil and gas fields are no exception. The typical equations used to quantify and oil or gas field size are shown in Figure 10. When combined, these different variables multiply to define the volume of recoverable oil or gas present.
Geologists, geophysicists, and engineers work together to determine the likely end points of the lognormal distribution. Knowing the end-point values combined with the lognormal distribution fixes the probability distribution likely to occur for a given asset.
For example, an asset team composed of a geologist, geophysicist, and engineer can derive an optimistic case based on a high side range of pay thickness, area extent, porosity, and pressure and assign it to the P10 value; that is a probability that the optimistic case will occur 10% of the time or more.
The same team can also derive a pessimistic case, which represents the low side of the net thickness range, area extent, porosity, and pressure values. The pessimistic case is assigned to the P90 value; that is a probability that the pessimistic case will occur 90% of the time or more. Knowing these values, the P50 case can be derived which is simply the square root of the P10 multiplied by the P90 case.
Mode, median, mean, truncated mean, and Swanson’s mean
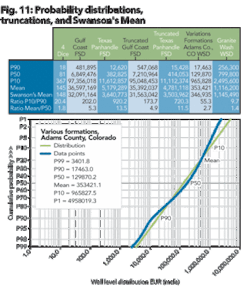
Normal distributions are the most familiar of statistical distributions, and most people have an intuitive grasp of its properties. If the geoscientist uses the median value, then the prospect will improve somewhat as it will be found to be of higher value and to the right of the mode in a lognormal distribution. Only the mean, which is of higher value than the median or mode, is likely to be economic. Yet, each point along the lognormal distribution has a possibility of occurrence even those with a 0.1% likelihood.
Because of economic limits on the low end of the lognormal distribution and because of the low probability of occurrence on the high end of the distribution, geoscientists often truncate those values that lie outside of the P1 and P99 limits. For symmetry and a measure of conservatism, the values at the high end are also excluded. The mean derived from the truncated lognormal distribution is referred to as a truncated mean. The truncated mean introduces a conservative bias to the analysis.
For communication simplicity in bridging the statistical world to the managerial world, Roy Swanson introduced a short hand method of computing the lognormal mean. This method continues to be used extensively in the industry. The method is to weight the P10 and P90 values at 30% each and the P50 value at 40%. This computation has become known as Swanson’s mean and is shown below:
Swanson’s Mean = 0.3*P10 + 0.4*P50 + 0.3*P90
Swanson’s mean provides a reasonable method for estimating the truncated lognormal mean, especially when dealing with ratios of P10/P90 of 50 or less. This again, introduces a conservative bias to the analysis, which is often desired in risk adverse ventures.
Figure 11 shows a comparison of Swanson’s mean to the mean and median values. Also introduced in Figure 11 is a well-level distribution of various producing formations for Adams County, Colo. As with the field-size distribution, a well-level distribution shows a lognormal behavior particularly between the P10 and P90 values.
Well-level distributions isolated to a particular producing county, typically have lower P10/P90 ratios and are reasonably well estimated with the Swanson’s mean calculation. This is the typical evaluation performed by an explorationist, a well-level evaluation, rather than a field wide evaluation for a given prospect within a given basin.
Applying the concepts
For a given oil and gas prospect, the evaluation team gathers data to determine the range of possible variables to expect. If the prospect involves seismic information, the geophysicist can provide an optimistic and pessimistic interpretation of the amount of hydrocarbon trapped above a known water level.
Ultimately, the team will determine an optimistic and pessimistic distribution of potential reserves. Initially, these values will be plotted as P90 and P10 points. The lognormal distribution will be extrapolated to P99 and P1 values and tested for reasonableness based on the experience of the team and analogs in similar geologic settings. The P90, P50, and P10 values will be noted and the required investments for each of these reserve levels will be estimated.
Large reserve targets require larger investments than smaller reserve targets. If the geologic probability of success, Pg, is less than 1.0 which is typically the case except in the case of certain infill drilling locations, then the team will work to determine the various component risks of Pg.
Stochastics and Monte Carlo simulation
With the variances of each asset defined stochastically via a binomial risk of success or failure plus the lognormal distribution of the successful outcomes, an analyst is able to gain insight into the dynamics of various asset combinations within the portfolio. Generally, this insight is gained through a Monte Carlo simulation of the portfolio’s possible outcomes.
When the various oil and gas prospects are defined probabilistically within the model, the Monte Carlo simulation can generate multiple random outcomes. With a working portfolio model, constraints can be added to the system, which can give further insight on the behavior of the portfolio’s assets. Production volumes can be increased and the portfolio forward modeled to determine the likelihood of achieving the given result.
Portfolio management and corporate strategy
Portfolio management has evolved from concepts introduced via Markowitz but also through the understanding of risk and uncertainty endemic to the oil industry. Portfolio management is the culmination of an understanding of risk analysis, risk management, and portfolio analysis.
In the development of an objective working portfolio, “risk analysis requires a systematic and consist approach to prospect evaluation. A petroleum system approach that addresses charge, trap, seal, and reservoir performance parameters is essential to success. Risk management uses this information to compare alternatives. Portfolio analysis builds on risk analysis and risk management by determining the interrelationships of individual assets or opportunities and developing options for the decision-makers. It is crucial that the portfolio chosen exposes”3 the firm to those opportunities, which best align the firm with its goals.
While modern portfolio theory within a financial framework addresses the proper allocation of assets based on their interactions, a portfolio of oil and gas assets and opportunities provides a planning tool for organizational management. Based on a portfolio approach to oil and gas assets and opportunities, management has the ability to ask questions and get consistent answers on such issues as:
- Are the performance goals [of the organization] achievable?
- If the goals cannot be achieved, what options exist to make the goals more realizable?
- If the goals are achievable, what is the likelihood that they will be satisfied?
- If the goals can be met, what options exist to improve the probability of satisfying the goals?
- What are the business implications of changing goals?4
A portfolio model of opportunities built around a binomial and lognormal distribution when combined with corporate constraints can be a powerful evaluation tool. Different constraints can be modeled. The risk or probability of shifting the assets in time can also be observed.
The Markowitz technique of aggregating opportunities and evaluating their interaction has an important place in the valuation and management of oil and gas properties. Additionally, within an oil and gas firm, a portfolio model is also useful in corporate strategy evaluation. Assets and opportunities can be added to or removed from the portfolio and their effect on achieving the firm’s goals can be evaluated. Because of the lognormal and binomial distribution of oil and gas opportunity sets, statistical models can be assembled to determine the probability of achieving a given goal.
Conclusion
While Markowitz utilized past security performance to determine asset interactions and correlations, oil and gas property statistics are developed by a professional team of geoscientists and engineers. Nevertheless, these stochastics can be used with Monte Carlo simulation techniques to determine efficient frontiers, to determine the likelihood of achieving firm objectives, and the critical significance of any particular asset or opportunity to the portfolio.
Based on an inherent appreciation of the impact of uncertainty in the oil and gas industry, portfolio theory provides a mechanism for balancing risk and return. Understanding company opportunities in light of portfolio interactions enable management to see the bigger picture as they lead their organizations forward. OGFJ
Bibliography
- Capen, E.C. “Why Lognormal?”, this informal article by Ed Capen first appeared in 1984 in the Course Notes for the AAPG School, Evaluating and Managing Petroleum Risk (Capen, Megill, and Rose).
- Rose, Peter R. Risk Analysis and Management of Petroleum Exploration Ventures, American Association of Petroleum Geologists (June 2001).
- McMaster, Glenn E. “New Trends in Exploration Risk Analysis”, Supplemental Readings, Peter Rose Course, 1997.
- Howell, J.I. III; Tyler, P.A. “Using Portfolio Analysis to Develop Corporate Strategy”, Society of Petroleum Engineers, SPE 68576, SPE Hydrocarbon Economics and Evaluation Symposium held in Dallas, Texas, 2-3 April 2001.
- Dake, L.P. Fundamentals of Reservoir Engineering, Elsevier Scientific Publishing Company, 1978, pp. 1-44.
About the author
Gary Cartwright [[email protected]] is corporate portfolio advisor for Devon Energy Corp. in Oklahoma City. He holds a bachelor’s and an MBA degree from the University of Oklahoma and a law degree from Oklahoma City University College of Law. Cartwright has work experience in reservoir engineering and drilling engineering for Exxon Corp., Texas Oil and Gas/Marathon Oil, and Enron Oil and Gas/EOG Resources. He has been with Devon since 2006.
