Oil and gas prices and property deal flow: how they're related
William A. Marko
Oil & Gas Journal Exchange/Madison Energy Advisors, Houston
One of the most talked-about topics in the oil and gas industry is acquisition and divestment deal flow. It seems that every week or two an interesting announcement is made by a buyer or seller of oil and gas properties.
Acquisition is one of two primary ways—the other being drillbit growth— to expand an exploration and production company. An acquisition changes the nature of both the buyer and the seller; one trades volumes and reserves for money, and the other trades money for volumes and reserves.
Past, present, and future oil and gas prices have a great effect on deal flow. Two aspects of pricing are important. One is the absolute level of price at any given time. On the tangible side, this affects operating cash flow. Current commodity prices are helping E&P companies attain record revenues and earnings. On the intangible side, price influences how decision-makers feel about the business. With high prices, decision-makers feel optimistic about the business; with low prices, they are not confident.
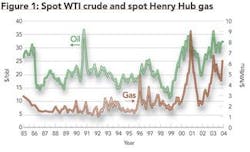
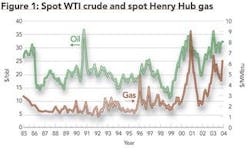
The second aspect of pricing is volatility. Fig. 1 shows oil and gas prices over the last 20 years. Since 1998, commodity prices have become a great deal more volatile than they had been in the past. Beginning in 1998, oil and gas prices decreased dramatically, hitting lows of about $1.75/MMbtu and $12/bbl in 1999. Prices then increased through 2000, hitting highs in 2001 of almost $9/MMbtu and $34/bbl, an unprecedented increase in such little time. The roller coaster has continued, with prices bottoming in 2002 and once again peaking in 2003.
New price norm?
The volatility of these 5 years seems to be leading to a new norm of commodity pricing. From 1985 to 1998, the natural gas price fluctuated generally between $1.50/MMbtu and $2.50/MMbtu. The oil price was generally between $18/bbl and $22/bbl during the same period. Companies used these ranges for long-term planning and evaluations of acquisitions and divestments.
Since 2000, prices have exceeded those planning ranges for several reasons. A challenge for the industry is to figure out what the new normal price ranges for oil and gas may be. At present, they seem to be $4-5/MMbtu for gas and $26-30/bbl for oil. But are prices at these levels sustainable? Are they "right?" Has volatility decreased in the last year? What factors might cause large changes in future oil and gas prices? Oil and gas company chief executives ask these questions every day.
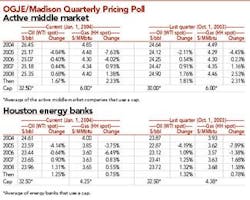
For the past 10 years, OGJE/ Madison Energy Advisors has conducted its Quarterly Pricing Poll (QPP) to provide an industry outlook of future price. Madison polls two groups of four companies each: 1) a "middle market" group consisting of active buyers and sellers of producing properties, and 2) a group of Houston-based energy banks. The confidential responses are then averaged and reported.
The latest QPP, from January 2004, appears in the table, with values compared with those of the October 2003 QPP. Noteworthy comparisons are between QPPs of the two quarters and the outlooks of the middle-market companies and banks. It is also interesting to compare the near-term QPP price with the current strip and the spot market. Today, with commodity prices high, the QPP results are generally lower than the prevailing short-term outlook. This reflects the industry's belief that $6/MMbtu gas and $35/bbl oil are not sustainable.
Results of the QPP provide a neutral, unbiased outlook on future pricing from the perspectives of the two groups. At times of stable commodity price, the middle-market and bank price outlooks are quite similar; at times of volatility, the two perspectives can be quite different.
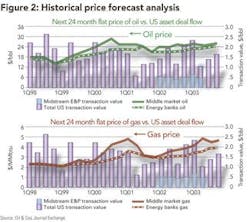
In order to examine the impact of the level of consensus on asset deal flow, Madison has plotted QPP price outlook represented by a flat price compared to the US upstream asset deal flow in each quarter. The line graphs of Fig. 2 show flat QPP oil price vs. quarterly US asset deal flow, and flat QPP gas price vs. quarterly US asset deal flow.
The QPP flat price is the average of the next 24 months' price outlooks for each quarter, calculated for oil and gas and for the middle-market and energy-bank sources. For example, the January 2004 middle-market flat price for oil is the average of the 2004 price of $26.45 per barrel and the 2005 price of $25.17/bbl, or $25.81/bbl. The QPP flat price for July 2002 is the average of the price for the final 6 months of 2002, all of 2003, and the first 6 months of 2004.
Deal flow down
Quarterly US upstream deal flow totals are shown in the bar charts of Fig. 2. Prior to the recent commodity price volatility, deal flow was $1.5-2.5 billion/quarter from 1998 to 2000. Since then, no doubt due a great deal to increased price volatility, deal flow has been lower.
Distress sales by midstream marketing and trading companies, mainly Williams Cos. and El Paso Corp., recently have increased deal flow. From the first quarter of 2002 through the third quarter of 2003, these companies have sold upstream, US assets worth $500 million-$1 billion/quarter. Their sales have boosted near-term deal flow.
If the Williams and El Paso sales are removed to normalize the numbers, deal flow during 2001-03 was about one-half the level of prior years, or $750 million-$1.25 billion/quarter.
Comparison of the future price between the middle market and energy banks with the asset deal flow shows that consensus between the two groups leads to good deal flow and that lack of consensus leads to poor deal flow. There is a time lag between consensus and subsequent deal flow of about 9 months. This is about the time a company requires to complete a large property sale from the moment it decides to sell until a deal is closed. This suggests that companies are more encouraged to sell properties in periods of consensus in price. The opposite is also true.
Throughout all of 1998 and into 1999 there was good consensus on future price and hence strong deal flow through the first quarter of 2000. Then, a building gap in price between the middle market and banks led to a decline in deal flow in the second quarter of 2001. This trend has continued, and the level of asset sales continues to be choppy.
Interestingly, the consensus is improving much more quickly for oil than for natural gas. This is reflected in the market, with the number of deals available and the attractive prices being paid recently for oil properties.
The new level
What does this mean for future property sales? This is an interesting time for oil and gas companies, whether they're buying, selling, or holding.
The key question is, as always, "What is the real outlook for oil and gas prices?" Most companies expect a new range of prices; the key is deciding what that new range is and if the presumed level is competitive in the marketplace.
Should a company be buying or selling based on $4.50/MMbtu gas, or should the level exceed $5/MMbtu? For an oil transaction, is $27/bbl an appropriate outlook? Is it higher than $30/bbl? Can it be higher than $35/bbl?
Some companies are aggressively selling properties on the assumption that commodity prices are at the upper end of historical ranges and unlikely to go much higher. Buyers with this price outlook are bidding aggressively while the supply of properties is relatively low. The number of companies interested in acquisitions has increased in the last few years, but the quarterly deal flow size has decreased.
The recent prices of properties changing hands offer companies strong opportunities to raise cash. But, of course, this dilutes their production volumes and reserves.
Companies are also selling as part of acquisition programs. One attractive model is to sell assets immediately following an acquisition and even to make the sale announcement part of the acquisition announcement. This may include a pruning of the acquired properties or other noncore properties in a company's portfolio.
Some waiting
Not all companies think now is a good time to buy or sell. Many are waiting to see how this new market settles out. Growth of production continues to be a key concern, especially for public companies. Production growth and reserve replacement indicate the health of an E&P company.
High cash flows cause all properties to look more attractive and may cause companies to hold noncore properties. There is also the challenge of what to do with the money. Many companies face a lack not of capital but of viable investment opportunities. This can result from a lack of acreage, of development projects, or of manpower to design and manage capital programs.
True confidence may be returning to the upstream business. Commodity prices have been high and relatively stable. The greatest concern at this time is at which level they will settle. Capital spending is growing, although many companies are turning toward the drillbit and away from acquisitions in this high-cost buying environment. This, of course, bodes well for sellers.
Asset deal flow will return to a higher level than it has been in the past few years. The majors will continue large-scale US asset sale programs, possibly larger than what has been carried out since the megamerger days. These large-scale sales, which could for some companies exceed $1 billion in size, will spawn other sales. A successful buyer of a billion-dollar package will no doubt prune the package or sell other assets, further fueling the asset sales market.
The author
William A. (Bill) Marko is chief operating officer of OGJE/Madison Energy Advisors, an oil and gas transaction advisory affiliated with Oil & Gas Journal. He worked with Mobil Oil Corp. for 18 years and spent 2 years in management consulting before joining Madison Energy Advisors in February 2000. Madison later was acquired by PennWell Corp.'s Oil & Gas Journal Property Exchange. Marko holds a BS in mechanical engineering and MS in petroleum engineering from Tulane University.


