Emissions from liquid unloadings vary by region
Adam P. Pacsi
University of Texas at Austin
Austin
Matthew Harrison
URS Corp.
Austin
A recent study by the University of Texas at Austin and the environmental testing firm URS indicated that a small percentage of wells account for the majority of methane emissions from liquid unloadings at US natural gas wells.
There are many liquid unloading options available to assist in the removal of accumulated liquids from the wellbore in order to increase the gas production rate, and not all unloading methods result in emissions; however, approximately 13% of US gas wells have liquid unloadings that do result in methane emissions.
The University of Texas-URS study, (published Dec. 9, 2014, in Environmental Science & Technology,) focused on two technical options that can result in emissions: venting from wells equipped with plunger lift and venting from nonplunger lift wells. Both options result in direct emissions of natural gas from an atmospheric storage tank.
Emissions from unloadings of wells with and without plunger lifts accounted for 12% of the total methane emissions from gas production in 2012 based on the national extrapolation from the University of Texas-URS study.
High-emitting well characteristics
The University of Texas-URS study found that approximately 10% of the wells with unloading emissions account for more than half of unloading emissions. Given this skewed distribution of annual methane emissions per well and the increased interest in federal and state regulations for this source category, enhanced understanding of the causes of wells with high unloading emissions is vital.
The primary driver of high annual emissions for wells on which measurements were made in the University of Texas-URS study was the frequency of well unloading with atmospheric venting. In particular, aggregated annual emissions from wells with automated plunger lifts, which account for only 9% of the wells that vent for liquid unloadings nationally, accounted for 56% of overall emissions from liquid unloadings.
Emissions from individual unloading events from these wells were lower than for other types of wells on which measurements were made, but annual emissions are high because of the frequency of vented emissions, which ranged from 200 to 7500 events/year. The frequency of venting events was correlated in the study with the age of the well since older wells can have lower gas production velocity and may need increased frequency of liquid unloading to clear the wellbore.
Geographic variability
Understanding the formation in which the well is completed is important when considering alternatives for addressing emissions from liquid unloadings.
While the University of Texas-URS study directly reported national emission estimates only from liquid unloadings, the emissions estimation methodology and data from the study could be used to examine methane emission rates from various gas plays.
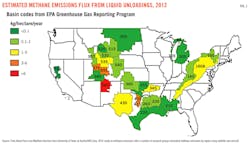
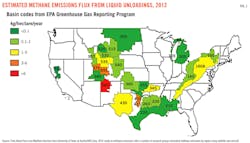
From measurements of emissions per event from the University of Texas-URS study, estimates of event frequencies from the study, and well counts by basin from the Environmental Protection Agency Greenhouse Gas Reporting Program (GHGRP) data system for reporting year 2012, the emissions from liquid unloadings in specific production basins can be estimated (Fig. 1).
Emissions from liquid unloadings in the San Juan basin, in southwestern Colorado and northwestern New Mexico, account for an estimated 32% of national methane emissions from liquid unloadings based on a basin-specific scale-up of the University of Texas-URS study data. The unloadings emission estimate from the San Juan Basin is driven by some unique features compared to other basins nationally. For example, based on the study results, 57% of the wells that vent for liquid unloadings in the San Juan basin are classified as automated plunger lift wells (compared to 9% nationally). In addition to the San Juan basin, the Permian basin (430) in West Texas and the Appalachian Eastern Overthrust (160A) are estimated to contribute in excess of 10% of the national methane emissions from liquid unloadings.
Implications
Recently, a number of research groups have estimated methane emissions in particular geographical regions based on data collected with satellites or aircraft overflights. These studies have reported significant geographical variability in emission rates from region to region. Emissions from liquid unloadings account for some of this variability.
Fig. 2 shows the annual methane emissions estimate from liquid unloadings (from Fig. 1) divided by the geographic area of the basin, giving an average methane emissions flux (a metric analogous to the measurements made by aircraft and satellites) from liquid unloadings in each basin.
The flux approach leads to an emphasis on basins different than the overall emissions estimation method, although the San Juan remains the most prominent area by the flux metric as well. By this metric, the Permian basin (430) and the Appalachian Eastern Overthrust (160A), which both cover a geographic area of greater than 100,000 sq miles, have average emissions flux from liquid unloadings lower than basins with a smaller geographic footprint, including the Uintah Basin (575), the Piceance basin (595), the Fort Worth syncline (420), and the Strawn basin (415).
Limitations should be noted regarding this simplistic approach to estimating the methane flux from liquid unloadings in these regions. Liquid unloadings are not necessarily evenly distributed over the entire basin.
More liquid unloadings would be expected in the portions of Basin 160A in Ohio, Pennsylvania, or West Virginia than in eastern Tennessee due to the relative prevalence of oil and gas activities in certain areas. In addition, care should be made in making comparisons of the data presented here to the EPA GHGRP data as the GHGRP allows for estimation methods to be used, rather than direct measurements.
Citations are available by contacting the primary author.
The authors
Adam Pacsi was a postdoctoral fellow at the Center for Energy and Environmental Resources (CEER) at the University of Texas at Austin at the time of the submission of this article. His research activities has focused on the air quality, water use, and greenhouse gas impacts of oil and gas development and changes in the power sector. He holds a PhD in chemical engineering from the University of Texas at Austin and a BS in chemical engineering from Tulane University in New Orleans. He accepted a position with Chevron Energy Technology Co. began in early 2015. His e-mail address is [email protected].
Matt Harrison is vice-president with URS Corp., which is part of AECOM. Harrison holds a bachelors in chemical engineering from the University of Texas at Austin. He started his career with Exxon in Baytown, Tex. He has served the oil and gas industry for almost 3 decades, and he currently leads teams providing environmental services to a variety of energy clients. Harrison is the greenhouse gas national practice leader for URS. His e-mail address is [email protected].

