Study estimates Gulf of Mexico decommissioning costs
A study has established decommissioning costs of Gulf of Mexico oil and gas production structures according to the stage of activity and was the first empirical analysis to construct the cost based on actual data.
The study provides a useful baseline and guide to cost engineers, project managers, and other personnel involved in estimating costs.1
For the gulf, the scarcity of data and proprietary nature of cost statistics create uncertainty regarding the value and nature of decommissioning cost.
Decommissioning
In the federally regulated Outer Continental Shelf (OCS), the gulf currently has about 4,000 structures associated with oil and gas production. The structures vary widely according to function and configuration.
Since 1947, when offshore production started in the gulf, the industry has installed in OCS waters about 6,000 structures and removed about 2,000.
When the operating cost of a structure (maintenance, operating personnel, transportation, fuel, etc.) outstrips the income from the produced hydrocarbons, the structure becomes a liability instead of an asset.
Decisions about when and how to decommission a structure involve issues of environmental protection, safety, cost, and strategic opportunity. Factors influencing the timing and manner of removal are complicated and depend on technical requirements and costs as well as on preferences established by the contractor and the scheduling of the operation.
Decommissioning projects aim to render all wells safe and remove most, if not all, surface and seabed signs of production activity. Simple structures in shallow waters are removed relatively easily and inexpensively. Free-standing caissons, for example, are just big pipes in the ground that a lift vessel or stiff-leg in conjunction with a diving crew usually can cut, pull, and place on a cargo barge.
Braced caissons, well protectors, and fixed platforms, on the other hand, are more complex structures that require greater planning and preparation to ensure worker health and safety while minimizing environmental impact and removal cost.
The removal process generally becomes more complicated and costly as the structure size, complexity, and water depth increases.
The US Minerals Management Service (MMS) requires that within 1 year of the termination of a lease all wells be plugged and abandoned; all conductors, casing string, and piles be removed to a depth of 15 ft below the mudline; and the site be returned to prelease conditions.
Stages
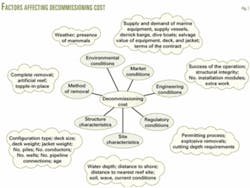
Decommissioning occurs in stages that typically take place during disjointed time frames (Fig 1). Following project engineering and cost assessment, a company must obtain from the MMS federal and state regulatory approval for the decommissioning work that includes:
- Plugging and abandoning (P&A) wells.
- Preparing the facility for removal, including flushing and cleaning process components, installing pad eyes, etc.
- Pigging or flushing pipelines from riser to riser and riser to subsea tie-in and detaching the pipeline from the structure. Most pipelines are left in place with the ends capped and buried 3 ft below the mudline.
- Removing modules, if required, separate from the deck,
- Cutting and removing the deck, conductors, and piles.
- Using a heavy lift vessel to bring the jacket ashore for recycling, sale, or scrap, or for disposal at a reefing program site.
- Clearing the site after the removal of the structure.
- Verifying the site clearance with a trawling vessel with side-scan sonar or divers. The operator must verify the clearance within 60 days after removing the structure.
Removal methods
Decisions about when and how to decommission a structure involve complicated issues related to environmental protection, safety, cost, and strategic objectives. Decommissioning is also tailored for the specific configuration involved because most structures are customized.
The normal practice removes all structural elements (equipment, deck, and jacket) and brings the elements ashore for reuse or disposal as scrap (Fig. 2)
An alternative option, used about 10% of the time, takes the structure (deck or jacket) to an artificial reef site for disposal.2 3
The factors involved in selecting the removal method for a specific decommissioning activity include cost, safety, risk of failure, and technical feasibility of the operation. Unfortunately, cost, safety, failure risk, and technical feasibility are not easy to quantify.
The removal costs are known to some extent at the operator level but such data are not publicly available nor reported to the MMS. Safety issues are well known in general terms but are difficult to specify. The risk of failure and technical feasibility is company, site, and time specific.
Numerous variable drive the cost and risk associated with structure removals and involve factors such as the location and nature of the site, structure characteristics, the amount of pre-planning involved in the operation, salvage and reuse decisions of the operator, marine equipment availability, contractor experience in decommissioning, environmental conditions at the time of the procedure, etc (Fig. 3).
Some variables are observable, such as site and structure characteristics, but the degree of correlation with the contractor decision variables are weak and therefore the extent to which a company can accurately predict structure removal methods based on these factors is uncertain.
TSB database
Twatchman, Synder and Byrd Inc. (TSB) serves as a third party in the decommissioning planning and management operation and bids out the execution activity to service contractors on the operator's behalf. In the gulf since 1987, it has managed more than 200 projects valued at about $250 million.
TSB maintains a database on these projects that served as the source for the cost data in this analysis.
The database has 11 service categories that the analysis reduced to 6 in order to mimic the main decommissioning stages and minimize the overlap between the service activities. The six categories are: plugging and abandonment, structure preparation, pipeline abandonment, structure removal, site clearance and verification, and diving services.
The decommissioning cost reported for structures in Category i (i = 1,...,6) is denoted ci(s) so that, for instance, c2(s) represents the cost to prepare the structure for removal. The total gross cost to decommission a structure, TC(s), includes an 8% assumed project management fee and is the sum of the six component costs (Equation 1 in the equation box).
The salvage value c7(s), if any, for the equipment, deck modules, and jacket will reduce the decommissioning cost (Equation 2). Because the market for structural components in the gulf lacks liquidity, these benefits were reported in only a few cases; for the structures analyzed in this study, NC(s) = TC(s).
Data analysis
The TSB database reports cost elements ci(s), i = 1,..,7, and TC(s) for projects managed by the company since 1991. The study first filtered the cost entries and then eliminated ambiguous or incomplete entries, including projects currently in progress and projects that reported costs for only one service category.
A preference for jobs that involved only one structure helps to ensure a consistent comparison, but because decommissioning may involve 3, 10, or even 20 structures as a unit, the economies of scale from sequencing multiple removals is difficult to assess.
The analysis did not include projects with more than three removals per job and normalized multiple structure removals.
The initial filter passed 65 of 150 entries. A random check of the post-job reports ensured the accuracy of the reported data and the consistency of the cost assignment. The check eliminated an additional five projects because of inconsistent or missing data.
The final data set included 60 structure removals dating from 1991 to 2001.
Cost statistics
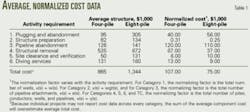
Table 1 summarizes the decommissioning cost statistics for the 60 structures. Cost data are reported as nominal values, without an adjustment for inflation.
The average total cost to removal was $855,000 for a four-pile and $1.344 million for an eight-pile structure. But normalized by structure complexity on a per-pile, well, conductor, and pipeline basis, the removal cost is $107,000 for a four-pile and $75,000 for an eight-pile, indicating economics of scale.
The analysis applied various normalizing factors to each category as follows:
- Category 1 (P&A wells)—The normalizing factor is the total number of wells, n(s) = w(s).
- Category 2 (structure preparation)—The normalizing factor is the maximum of the deck and jacket weight, n(s) = wgt(s) = max(wd(s), wj(s)).
- Category 3 (pipeline abandonment)—The normalizing factor is the total number of pipeline attachments, n(s) = e(s).
- Category 4 (structure removal), Category 5 (site clearance and verification), Category 6 (diving services), and TC (total cost), the normalizing factor is the total number of piles, conductors, wells, and pipelines, n(s) = g(s).
The single most important cost in decommissioning activities is the structure removal stage that involves cutting and removing the deck, conductors, piling, and jacket from the seabed. Table 1 shows the costs involved.
For the most part, eight-pile structures are not only larger than four-pile structures and occur in deeper waters, they are also more complex and require more personnel in the removal operation.
In some cases, the well P&A costs may rival the removal cost. On a normalized basis, the cost characteristics demonstrate economies of scale across several categories.
The public domain contains limited cost data, but care must be taken to ensure the veracity of the data because most reported values represent engineering (pre-job) estimates as opposed to actual (post-job) cost data.
The MMS employed a $63,300/well P&A cost estimate for a "no complications" scenario and a $192,400/well cost for a "major complications" scenario for the Pacific OCS.4 It uses a $100,000/well value to estimate operator bonding requirements.
One report indicated an average $88,000/well P&A cost for four platform removals in the Pacific OCS.5
The MMS assumes preparation cost to be 6% of the total decommissioning cost, or $1,000/ton. This is the same order-of-magnitude as the normalized values in Table 1.
A TBS study estimated for deepwater structures a preparation cost of $800/ton of platform weight and $1,400/ton of jacket weight.6 Other studies provide engineering estimates for decommissioning cost as a function of water depth and structure type as well as additional cost statistics.7-10
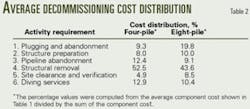
Table 2 shows the cost distribution for decommissioning activities based on average cost data. The removal operation is the primary cost category; therefore, any activity minimizing the time a derrick barge spread is on site will reduce significantly decommissioning costs.
Well P&A, pipeline abandonment, structure preparation, and diving services are all important activities contributing roughly the same cost per activity on an average structure basis and generally are about 10% of the decommissioning cost.
Site clearance and verification operations represent the smallest cost activity.
Well P&A
Well P&A essentially involves setting various cement plugs downhole to ensure isolation of hydrocarbon zones. This serves to protect freshwater aquifers and prevents the migration of formation fluids within the wellbore or to the seafloor.
P&A techniques are based on industry experience and conformance with regulatory standards and requirements.12 13
Well P&A may occur before, during, or after completing removal preparation activities, but all wells must be P&A'd prior to cutting and removing the conductors.
Plugging is normally done well in advance of removal operations. The primary factor determining P&A cost is the degree of difficulty encountered with the well, such as unforeseen time or operational delays.
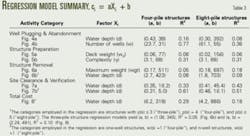
Fig. 4a and Table 3 show P&A cost as a function of water depth for projects that reported P&A activity. These activities were the least reported entries in the TSB database, indicating that the operation occurred prior to the project management team's involvement.
P&A cost tends to increase with water depth because deepwater structures tend to support more wells. P&A costs on an eight-pile structure are greater than on a four-pile structure simply because an eight-pile structure usually has more wells.
The similar slope trends in Fig. 4a support the conclusion that the same dynamics act on the P&A cost functions across each structure category.
Fig. 4b depicts P&A cost as a function of the number of wells on each structure. The linear fits in Fig. 4b are more robust, relatively speaking, and as the number of wells increase, the cost to P&A wells increases at rates unique to the structure type.
The regression models also yield other useful information. The unit cost to P&A a well on a four-pile structure decreases with the number of wells, so that the unit cost to P&A one well is $54,000, while for four wells, the unit cost is $31,000.
Eight-piles exhibit the same economies of scale but at about twice the magnitude as four-piles. The average cost to P&A a well based on the water depth is $380/ft.
Structure preparation
Normally a crew paid on a day rate prepares a structure for removal after the P&A of wells. The preparations involve an inspection above and sometimes below water to determine the condition of the structure and identify potential problems with the salvage.
Divers or a remotely-operated vehicle perform the inspections, depending on the water depth. Divers can operate effectively up to 300 ft.
On deck, the crew flushes and cleans all piping and equipment that contained hydrocarbons. They cut loose all modules to be removed separately from the deck and then the piping, electrical, and instrumentation interconnections between modules. Other work involves the preparation of the modules for lifting, such as installation of the lifting eyes.
In accordance with MMS regulations, the removal operation must dispose of all fluids and agents used to purge and clean the vessel by either pumping them into an injection well or into storage in tanks for transport to onshore disposal. Sent ashore for recycle or scrap are the removed equipment and other metallic debris, while non-metallic debris go as waste to a landfill.
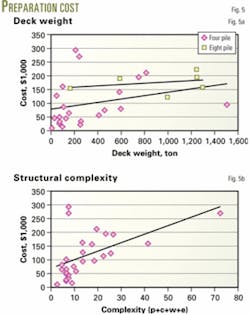
The structure size and complexity, topsides equipment, and possibly structure age are factors that affect preparation cost. Figs. 5a and 5b show the structure preparation cost as a function of deck weight and structure complexity.
Deck weight serves as a proxy for the topsides equipment preparation costs that increase as deck weight increases (Fig. 5a). For an eight-pile, the preparation cost, as expected, is greater than for a four-pile, but the linear fits indicate the data uncertainty and the inability for the model to capture the influence of unobservable factors.
In Fig. 5b, preparation cost as a function of structure complexity yields essentially identical increasing trends for each category.
Structure removal
Removal of the topside facilities, deck, conductors, piles, and jacket is the core of the decommissioning project. The work involves:
- Placing production equipment and deck modules on a cargo barge and returning them ashore for scrap or reuse.
- Cutting, pulling and removing conductors, casing strings, and pilings a least 15 ft below the mudline.
- Lifting and taking the jacket ashore or to an artificial reef site. Toppling in-place or partial removal is another option for the structure if it resides within a reef planning site.2 3
Several references discuss activity requirements associated with structure removal.6 7 12
Structural components that need to be removed are often large and heavy. Deck weight varies with the configuration type, the number and size of casing strings, and water depth. Fixed structures can weigh 20-150 tons or more. Jackets in 100 ft of water can weigh as much as 600 tons and in 300 ft more than 3,000 tons.
Soil shear resistance and grouting can add 10-15% to removal forces.8
Topsides vary greatly in functionality and complexity, from large integrated production, drilling, and quarters platforms, to processing only, drilling only, quarters only, gas compression only, or various combinations.
Because structures may have topsides that are integrated, modular, or hybrid in nature, the decommissioning may remove them in one piece, in groups of modules, in small pieces, or combinations thereof.12
Topsides removal follows the installation process in reverse sequence. Modules are removed and placed on a cargo barge and secured by welding pieces of steel pipe to the deck of the barge. The deck section or support frames are removed after cutting the welded connections between the piles and the deck legs. The deck is then seated in the load spreaders and secured for disposition.
Conductor severing and removal may take place as part of P&A activity or during the structure-removal operation. The conductors may contain multiple strings of well casing grouted together and with voids. Severing at the designated elevation is done with mechanical casing cutters, abrasive water jets, or explosives.
Conductors typically extend about 50 ft above the water, and hence the water depth plus 50 ft multiplied by the number of well slots gives an indication of conductor length. Conductor length drives the number of sections to be cut, stored, and offloaded, which in turn influences the type of cargo barge required.
Conductor removal costs about $200/ft.5
Structural piles driven deep into the seabed typically anchor the jacket. The piles may be grouted and well conductors may be inside, but typically, wells are drilled through a conductor bay in the center of the structure.
Pile removal involves preparing and installing explosives in the piles and skirt piles. The mud plug inside the pile is jet-air lifted if it is too shallow to allow placement of the explosive charge at the required depth.
Abrasive cutters are an alternative to explosives.
The direct cost of cutting conductors and piles is about $10,000/day for abrasive cutting and $5,000/day for explosive charges. The indirect cost associated with severance methods is more difficult to assess.
The jacket is removed in sections or as a single lift after the bottom cuts have been completed.
The capacity of the derrick barge (DB) combined with the space on the accompanying cargo barge or barges determines the maximum lift size. The maximum load weights expected determine the minimum DB required. Engineers estimate this weight from the blueprint specifications and physical characteristics of the structure (lift capacity, boom length, deck size, and jacket length).
The heaviest lift normally determines the DB capacity required.
In shallow water, the deck normally is the heaviest lift, while in deeper water the jacket normally exceeds the deck weight.
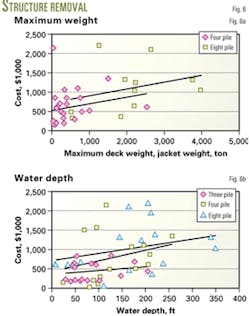
Fig. 6a depicts the removal cost as a function of maximum structure weight. The curve fits are unremarkable but the general trends again illustrate the "structural" similarity in the cost functions.
The maximum weight of four-pile structures tends to be less than 1,000 tons, while eight-piles have a considerably larger range.
The cost data spread across the two categories clearly illustrate that the removal cost of a four-pile can easily rival that of an eight-pile structure.
To obtain a cleaner delineation of removal cost, it is useful to classify structures according to a "minimal" categorization (structures with less than four-piles), four-pile structures, and structures with more than four-piles. The cost function associated with minimal structures should be nearly flat across water depth and dominated by the four and eight-pile structure cost functions.
Using this categorization, Fig. 6b shows the cost measures as partitioned and regressed as a function of water depth. Minimal structures have the smallest slope and are dominated by the four and eight-pile structure categories.
Because removal cost dominates the total decommissioning cost (Table 2), the general trends observed in Fig. 6b should reappear in the total decommissioning cost function.
Site clearance, verification
Site clearance and verification is the last task in decommissioning. Site clearance removes oil and gas related debris that have accumulated on the seafloor while verification ensures that the site is clear.
According to MMS regulations, all abandoned well and platform locations in water depths less than 300 ft must be cleared of all obstructions created by oil and gas activities. For clearance purposes, locations are defined as:
- 300-ft radius circle centered on the well for exploratory or delineation wells drilled with a mobile offshore drilling unit.
- 600-ft radius circle centered on the well for single-well caissons.
- 1,320-ft radius circle centered on the platform geometric center for platforms.
Platforms and single-well caissons in water depths less than 300 ft are trawled for clearance verification. The MMS's preferred verification technique is to drag a standard trawl net across the entire site in two directions.
In some cases, operators have used alternative-site verification techniques such as side-scan sonar or documentation of sweep assembly results.
After concluding the work, the operator must submit a completion report to MMS detailing the removal operation and certifying site clearance.
The time involved in clearing a site depends on equipment available, water depth, and the amount, size, and type of debris present.
Older and more complex structures, especially manned structures, may have more targets that are identified and removed; and therefore, the age of the structure and its configuration may affect the cost of clearance and verification.7 8
Greater water depth requires different removal methods. Trawling with heavy nets generally is effective to 300-ft water depths while deeper water might require remotely operated vehicles or even manned submersibles.
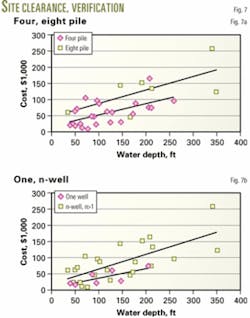
Fig. 7a shows site clearance and verification cost for four and eight-pile structures as a function of water depth. Clearing and verifying small structures such as caissons and wells in shallow water with minimal debris may cost $10,000 or less. Clearance of structures such as platforms may average $75,000, while verification operations typically are completed for $35,000 or less.
Deep, large sites with significant debris may cost a few $100,000 to clear and verify. These costs increase as the installation water depth increases (Table 3).
Fig. 7b shows a regression analysis on site clearance and verification under the MMS classification. Not surprisingly, the trend is even more robust because the data is aggregated in accordance with the regulatory constraints that presumably better captures the cost.
The average cost is about $0.033/sq ft for single-well caissons and $0.023/sq ft for all other structures.
Total cost
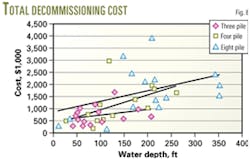
The total decommissioning cost is the sum of the component elements plus an assumed 8% project management fee. Fig. 8 shows the cost-per-category group, and as expected, the three-pile cost function shows only a moderate slope while the four and eight-pile functions increase more noticeably with water depth.
The eight-pile cost function dominates the four-pile cost function that in turn dominates the three-pile cost function.
The nature of the regressions is striking considering the data variability within each category.
The total cost range to remove a three-pile structure as a function of water depth is $0.5-$1.0 million, while for a four-pile the range is $0.5-$2.0 million. For an eight-pile, the range is $1.0-2.5 million.
Cost estimation
Decommissioning cost estimates serve a variety of purposes and can be viewed from several perspectives depending on the institutional and market requirements of the estimate.
Project managers and engineering firms that manage decommissioning projects, operators who manage but outsource their decommissioning activities, and contractors who bid to perform decommissioning services or who acquire sunset properties for production and decommissioning develop cost estimates.
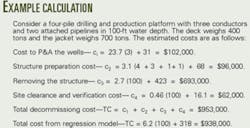
The calculation in the example box shows how one can apply the cost functions in practice.
The uncertainty bounds associated with an individual component cost and total decommissioning cost are about 20-50% of the values depicted.
There is a degree of "art" associated with cost functions, normally acquired during their development, and there is not necessarily one "right" way to perform the estimate.
Generally speaking, regression models for decommissioning cost are difficult to develop at high aggregation levels. Cost functions complement the engineer's ability to reliably estimate the cost, and they serve as a guide to less experienced engineers.
Cost functions will not replace the engineer's job because the site-specific nature of decommissioning means that many relevant factors cannot be incorporated within a function specification.
If data variability were smaller (less than 20%) and the linear fits stronger (R2 greater than 0.70), then perhaps the cost engineer's job could be in jeopardy. As shown, however, this is not nor is it expected to be the case across most stages of decommissioning.
References
1. Kaiser, M.J., Pulsipher, A.G., and Byrd, R.C., "Decommissioning Cost Functions in the Gulf of Mexico," ASCE Journal of Waterway, Port, Coastal and Ocean Engineering, Vol. 129, No. 6, November 2003.
2. Dauterive, L., Rigs-to-reefs, policy, progress, and perspective, MMS OCS Study 2000-073, 2001.
3. Reggio, V.C., Petroleum structures as artificial reefs: A compendium, MMS OCS Study 89-0021, 1989.
4. Offshore Facility Decommissioning Costs, Pacific OCS Region, MMS, March 1999.
5. McGinnis, M.V., et al., The politics, economics, and ecology of decommissioning offshore oil and gas structures, MMS OCS Study 2001-006, 2001.
6. Twachtman Synder & Byrd Inc., State of the Art of Removing Large Platforms Located in Deep Water, MMS, 2000.
7. Pulsipher, A.G. (editor), Proceedings: An International Workshop on Offshore Lease Abandonment and Platform Disposal: Technology, Regulation, and Environmental Effects, New Orleans, 1996.
8. An assessment of techniques for removing offshore structures, National Research Council, Marine Board, Washington: National Academy Press, 1996.
9. Greca, A.D., "Offshore facility removal: How to save cost and marine resources," SPE European Petroleum Conference, Milan, Italy, Vol. 2, 1996, pp. 549-56. 1996.
10. Pittard, A., Field abandonment costs vary widely worldwide," OGJ, May 17, 1997, p. 84.
11. Pulsipher, A.G. et al., "Explosives remain preferred method for platform abandonment," OGJ, May 6, 1996, p. 64.
12. Manago, F. and B. Williamson (editors), Proceedings: Public Workshop, Decommissioning and Removal of Oil and Gas Facilities Offshore California: Recent Experiences and Future Deepwater Challenges, MMS OCS Study 98-0023, September 1997.
13. Smith, D., Handbook on Well Plugging and Abandonment, Tulsa: PennWell Corp., 1993.
The authors
Mark J. Kaiser ([email protected]) is an associate professor–research at the Center for Energy Studies at Louisiana State University, Baton Rouge. His primary research interests are related to policy issues, modeling, and econometric studies in the energy industry. Prior to joining LSU in 2001, he held appointments at Auburn University, the American University of Armenia, and Wichita State University. Kaiser holds a PhD in industrial engineering and operations research from Purdue University.
Allan G. Pulsipher is the executive director and Marathon Oil Co. professor at the Center for Energy Studies at Louisiana State University. Prior to joining LSU in 1980, he served as chief economist for the Congressional Monitored Retrievable Storage Review Commission, chief economist at the Tennessee Valley Authority, a program officer with the Ford Foundation's division of resources and the environment, and on the faculties of Southern Illinois University and Texas A&M University. Pulsipher holds a PhD in economics from Tulane University.
Robert C. Byrd is a principal at Twachtman Snyder & Byrd Inc., Houston and is responsible for engineering and consulting services. He is a former Coast Guard officer and has over 25 years of experience in the offshore oil and gas industry. For the past 10 years he has focused on offshore platform decommissioning. Byrd has a BS in marine engineering from the US Coast Guard Academy and a PhD in engineering from the University of California, Berkeley.


