Growth patterns studied in large oil companies
Fifteen large oil companies were studied from 1991 to 2001 to assess growth rates in reserves and production. Five companies from the original group were acquired by others within the group during this period.
In the study, historical growth patterns were examined among large oil companies, using only the upstream segment of the business.
The key drivers for upstream growth are increases in production rates and reserves. Revenue and profit growth typically follow directly from increased production, although price fluctuations can strongly influence profitability.
The data for this study came from the annual reports and investor information released by Amerada Hess Corp., Amoco Oil Co., ARCO, BP PLC, Chevron Corp., Conoco Inc., Elf SA, Exxon Corp., Marathon Oil Co., Mobil Oil Corp., Phillips Petroleum Co., Royal Dutch/Shell, Total SA, Texaco Inc., and Unocal Corp. All of the information is publicly available.
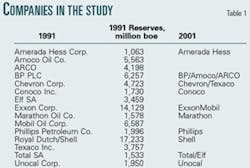
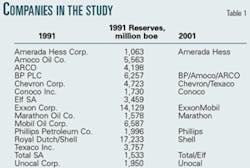
By 2001, 5 of the original 15 companies had been acquired by others in the group. The Conoco-Phillips merger is not included here, because it occurred in 2002. Because the corporate combinations took place entirely within the group, it is valid to compare changes in cumulative reserves and production rates for 1991-2001 (Table 1).
The period studied coincides with several key events in the oil industry including:
- Several cycles of low and high oil and gas prices.
- Several large mergers, such as BP, Amoco, and ARCO; Exxon and Mobil; and Total, Petrofina SA, and Elf.
- Major asset acquisitions, such as Chevron's Tengiz field purchase.
- Exploration of deepwater provinces in the Gulf of Mexico and the Atlantic margins of Africa, Europe, and Latin America.
Thus, the period is interesting in terms of industry developments as well as being long enough in duration to provide some meaningful conclusions.
Why conduct this study? One reason is to provide some reality checks for future growth expectations. If companies are promising to increase reserves 15%/year, is this reasonable, given historical growth rates?
Clearly, companies can achieve higher growth rates, but these expectations should be tested against actual data.
Also, this study will provide some guidelines for the magnitude of annual production replacement achievable through exploration, field growth, and acquisitions.
Terminology
According to Securities and Exchange Commission (SEC) regulations, reserves can be increased in four ways:
- Revisions to previous estimates of reserves in existing fields.
- Improved recovery of oil or gas in existing fields.
- Extensions and discoveries through exploration for new reserves.
- Purchases.
The first two categories, revisions and improved recovery, involve getting more oil from known fields.
Revisions result from new information gained from reservoir performance, development drilling, or a change in economic factors. In general, revisions are positive for large groups of fields, but they can also be negative.
Improved recovery results from capital investments that improve the overall recovery factor in a reservoir. The United States Geological Survey (USGS) includes a growth factor for reserves in known fields when making resource estimates of future reserves because reserves appreciation or reserves growth is well established in mature provinces such as the US.
In this study, reserves increases occur in the context of exploration (extensions and discoveries), field growth (revisions plus improved recovery), and purchases.
Purchases in the SEC context do not include corporate mergers. For example, Exxon's merger with Mobil in 1998 is not characterized as a reserves purchase for SEC reporting purposes.
Reserves are decreased in SEC terminology through revisions, sale of reserves, or production. As we have seen, revisions tend to increase reserves, so this category is relatively minor in terms of reducing reserves. The primary means for reducing reserves is through production or asset sales.
Reserves, production trends
The total amount of reserves in 1991 was determined by totalling worldwide oil-equivalent reserves for each of the 15 companies. Combined reserves for the group of companies were 75.8 billion boe.
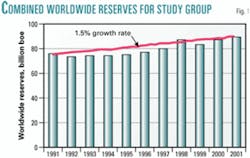
In 2001, total reserves for this same group of companies were 89.7 billion boe. The average rate of increase in reserves for this group of companies is 1.5%/year over the period (Fig. 1).
Given that individual companies within the group managed to increase reserves by up to 20%/year over the period, it may appear surprising that the group as a whole averaged only 1.5% reserves growth per year.
In fact, the average reserves growth rate for the 10 companies remaining in 2001 was 6.4%/year. How then did reserves for the entire group grow only 1.5%/year when individual companies grew at much higher rates?
The answer apparently lies in the corporate combinations that occurred within the group. Five companies included in the 1991 data set (Amoco, ARCO, Elf, Mobil, and Texaco) were acquired by other companies in the group during the 11-year period.
The remaining companies were thus able to achieve reserves growth rates of 6.4%/year on average by acquiring ownership of new reserves from other companies within the group. The underlying reserves for all of the companies combined meanwhile were growing at a modest 1.5%/year.
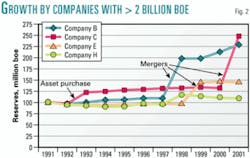
Companies with reserves >2 billion boe in 1991 increased reserves at very low rates except for asset purchases and mergers (Fig. 2). Between 1991 and 1997, these companies experienced reserves growth rates of <2%/year.
The low growth rates seen from 1991 to 1997, coupled with the low commodity prices and company values in 1998 and 1999, may have precipitated the mergers seen in the next few years.
It is quite clear from this plot, however, that reserves growth among the largest companies arose principally from major mergers and asset purchases rather than the organic growth capabilities internal to the companies.
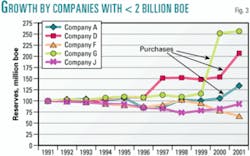
Reserves growth rates for companies with <2 billion boe reserves in 1991 are shown in Fig. 3. The results are even more striking for this group of companies. The only companies with positive reserves growth rates from 1991 to 2001 are those that made significant purchases.
One company has not been plotted on this chart due to scaling issues, but the story is similar for this company as well. Purchases-mergers are the main driver for significant growth in reserves for smaller companies as well as larger companies.
The companies shown in Figs. 2 and 3 represent many of the best exploration and development companies in the world and possess enormous technical and financial resources. Yet even these companies seem to need purchases or mergers to achieve significant growth.
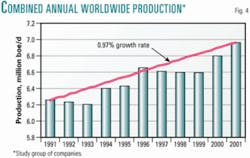
Combined production rates for the group of 15 companies were determined by adding the worldwide daily production rates in oil equivalent. Total production was 6.25 million boe/d in 1991. In 2001, total production for the surviving 10 companies was 6.96 million boe/d. The average rate of production growth for the group was a mere 0.97%/year during 1991-2001 (Fig. 4).
This result is also surprising, although less so, in view of the small growth in reserves for the companies. As in the case of reserves growth, individual companies increased production growth rates at much higher levels than the group overall achieved.
The average production growth rate for the 10 surviving companies was 5%/year, while the leading company achieved a production growth rate of 19%/year for the period. It appears that most of the growth in production for individual companies was achieved by acquiring other companies within the group rather than the overall rate of production climbing significantly.
While the data for companies with <2 billion boe are not shown here, the results are very similar to the largest companies. These reinforce the concept of the importance of major mergers and purchases to reserves and production growth.
Reserves-production ratios increased slightly over the period from 12.11 years to 13.21 years. The average increase was 0.8%/year. This is consistent with previous results in that reserves grew at a slightly faster rate than production for the companies.
Growth components
While mergers are not included within the SEC purchases category, they have been added back here to reflect the total contribution of reserves acquisition.
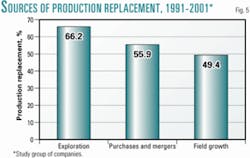
Fig. 5 shows the relative contribution of each of these growth vehicles in terms of replacing combined production for the 10 companies during 1991-2001.
Exploration activities replaced about two thirds of produced volumes for the period. Field growth replaced approximately 50%, and mergers and purchases accounted for about 55% of production.
In aggregate, 171.5% of production was replaced, implying a production growth rate of 5%/year for the period. As we have seen above, however, actual production grew by only 0.97% for the period. The higher apparent growth rate of 5% arises due to mergers redistributing production between companies.
Exploration and development (or field growth) functions are well-established contributors to the growth process at these large oil companies. As this study shows, exploration and development have combined to replace 115.6% of production over the 11-year period for an average annual growth rate of 1.3%. Such performance has allowed companies to increase reserves and production at modest rates.
The primary events enabling rapid growth, however, were almost exclusively mergers and asset purchases.
The costs of replacing production have been calculated using the incurred-costs figures given in annual reports for exploration, development, and property acquisitions.
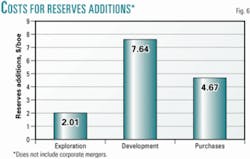
The incurred cost for exploration differs from exploration expense in that it includes the capitalized costs for exploration as well as the expensed costs. Fig. 6 shows the comparative costs incurred per barrel of oil equivalent by all companies from 1991 to 2001.
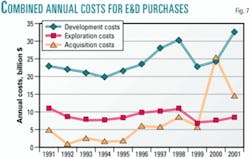
Exploration was the lowest-cost means of adding reserves 1991-2001. It is surprising, therefore, that companies have decreased exploration costs incurred by an average of 3%/year over this period (Fig. 7). Costs incurred for purchases meanwhile increased an average of 11%/year during the same period, so that costs incurred for purchases surpassed costs incurred for exploration.
Costs for purchases accelerated sharply between 1992 (when $927 million was spent on purchases) and 2000 (when total spending exceeded $25 billion).
Development costs increased an average of about 3%/year from 1991 to 2001 to a level about equal to the sum of exploration and purchase costs incurred. Overall spending has increased at a rate of 3.4%/year, while only exploration spending has decreased.
Analysis of reserves growth rate per year vs. percentage of original reserves added by exploration, field growth, and purchases is also evaluated here. Since there are only 10 companies in the survey, the results are not statistically significant but nonetheless interesting.
The approach used is to sum purchased reserves over the entire 1991-2001 period and divide by 1991 reserves for the company. This ratio normalizes cumulative reserves purchases from 1991-2001 to the 1991 reserves base for each company. This ratio is then plotted against the actual 1991-2001 reserves growth rate per year for each company.
In this way, it is possible to assess which components of growth have the strongest correlation with total reserves growth. The same approach has been used for the exploration and field-growth components of overall reserves growth.
The best correlation between 1991-2001 reserves growth rate per year and the growth contribution of each component comes from purchases. It should not be surprising that companies making the most purchases had the strongest reserves growth rates.
A company would have to purchase roughly twice its 1991 reserves to experience a reserves growth rate of about 17% overall.
There is a considerably poorer correlation between reserves growth rates and the growth contribution by exploration. One company achieved a high reserves growth rate of 17%/year while replacing only about 50% of 1991 reserves through 1991-2001 exploration.
Although poorly constrained, the best-fit line for exploration has a lower slope than the best-fit line for purchases. This implies that exploration is a more efficient way to grow than through purchases.
For example, doubling 1991 reserves through cumulative 1991-2001 exploration efforts would lead to reserves growth rates of 25%/year, whereas the same volume of reserves purchases would lead to a 17%/year growth rate. A similar relationship is seen for field growth.
These analyses show that exploration was the least expensive (yet apparently the most efficient) means of achieving high reserves growth rates for these companies from 1991 to 2001.
Purchases and mergers meanwhile offered the most reliable way of achieving high reserves growth rates, and did so in a relatively inefficient manner. Perhaps this is because exploration success adds reserves immediately as well as in future years through field growth.
Growth events
In addition to reviewing overall growth events, significant individual events were also studied. A list of major discoveries, field growth episodes, or purchases and mergers was also compiled for each company.
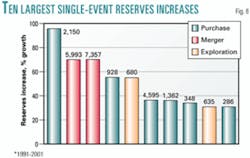
The largest reserves growth events in both an absolute or percentage increases in reserves were purchases and mergers (Fig. 8).
The two exploration events studied here were both heavy oil projects in Venezuela. In each case, large reserves were known to be present prior to feasibility studies to assess most-likely recovery factors.
As a result, both of these projects could also be characterized as improved recovery rather than exploration. In general, exploration and field growth reserves additions do not contribute enough reserves in a single year to be included on the list of the largest individual events.
Average annual production of about 8% of reserves is also shown for reference. One-year exploration reserves additions did not exceed annual production (400-1,600 million boe) for any company with reserves greater than 4 billion boe.
Larger companies still managed to add many barrels through exploration; indeed three of the biggest 1-year additions (761 million boe, 656 million boe, and 556 million boe) accounted for 4-5% reserves growth each for very large companies. Despite these achievements, exploration managed to replace roughly 50% of production for these giant companies.
For companies with <4 billion boe reserves, exceptional exploration events can successfully replace reserves produced (about 300 million boe) in a year. These events replaced or exceeded production 55% of the time for the smaller group of companies studied here.
The discrepancy between exploration reserves replacement among large and small companies implies that there is a limit on how much exploration can contribute.
The most likely factor is that there are not enough large prospects available to drill in any year; otherwise, a large company with large financial resources could simply drill more of these prospects and achieve its growth targets.
Smaller companies, meanwhile, can drill both large and moderate-size prospects to replace production because produced volumes are smaller.
Purchases and mergers offered the most potential for companies to increase reserves quickly from 1991 to 2001. Using purchases, companies were able to achieve high percentage reserves increases for almost all reserves sizes.
Nearly 15% of the purchases increased a company's reserves base by 50% or more. No single-year exploration event produced a reserves increase of 50%.
Implications
Based on historical data, large oil companies can expect reserves and production growth rates of about 1-1.5%/year, excluding the effects of purchases and mergers. With purchases and mergers included, annual growth rates may climb to 6-10%.
Exploration is the lowest cost and apparently most-efficient means of growth for this group of companies. The drawback for exploration is that returns appear to diminish with increasing size of the company.
For very large companies, exploration can replace a significant portion of production but will not provide a quantum leap to a higher reserves threshold.
This apparently stems from the limited number of large prospects accessible to the companies. For moderate and small companies (<2 billion boe), exploration remains a primary growth vehicle, and success can enable dramatic growth.
To take a specific example, consider ExxonMobil with reserves of 20.815 billion boe. For ExxonMobil to grow its current reserves base at an annual rate of 5% over the next 11 years, it would have to increase reserves by about 14.8 billion boe.
As we have seen, about 3.7 billion boe/year, or 1.5%/year, growth can be expected from ongoing exploration and production activities. To achieve a 5% annualized growth rate, however, ExxonMobil would need to add an incremental 11.1 billion boe.
How much can be added through exploration? If we look at the world's largest discoveries, excluding the Middle East and Mexico, from 1989 to 1999, these totaled about 33.9 billion boe.1
ExxonMobil would have needed an average net interest of 32% in all 19 of these discoveries to add 11.1 billion boe for this period. To achieve a 10% growth rate through exploration only, ExxonMobil would have needed an average net interest of 103%.
Field growth offers potential to increase reserves at low-risk but at high cost in small increments. The largest individual field growth event was 10% of reserves, but most are 6% or less.
Purchases and mergers can provide significant reserves boosts for large and small companies alike. The main risk is that growth through acquisitions is apparently not as efficient as growth through internal grassroots exploration and field growth.
A second risk for purchases is that companies are acquired at unprofitable prices.
While this can also occur in exploration and field growth, the magnitude of a single poor investment in an acquisition can be sufficient to create major financial problems for a company. It is less likely to happen in exploration, where investments are made in smaller amounts incrementally over time.
If we consider the ExxonMobil example from above, we can estimate how many barrels this company would need to purchase to achieve various growth rates. ExxonMobil would need to purchase a company about the size of ChevronTexaco or TotalFinaElf to attain a 5% annualized reserves growth rate.
For a 10% annual growth rate in reserves, ExxonMobil would have to purchase BP, ConocoPhillips, and ChevronTexaco to add about 34.8 billion boe.
Up to about 3-4 billion boe reserves, companies can grow quickly through both exploration and purchases. Above that, growth through exploration tends to slow, and companies must rely mainly on purchases to grow more rapidly.
Exploration and field growth, meanwhile, become the vehicles to sustain or grow reserves at a rate of about 2%/year. At this stage and for larger companies as well, the critical skill becomes the ability to capture and extract the maximum value from asset or corporate acquisitions.
Perhaps the most difficult period for companies is the transition from having two primary growth vehicles—exploration and purchases—to just one. Smaller companies that have grown quite successfully through exploration alone suddenly have to develop a new skill.
In some cases, companies may have had a poorly developed acquisitions capability, which is now critical to continued growth.
It is interesting to note that the 5 companies acquired out of the original group of 15 had reserves ranging from 3.499 billion boe to 6.931 billion boe.
Reference
1. Pettingill, Henry, "Giant Field Discoveries of the 1990s," The Leading Edge, 2001.
Acknowledgment
Thanks to Jim Geitgey for his help in reviewing this study.
The author
Jim Hollywood ([email protected]) is a management and technical consultant for international oil and gas companies. Based in Houston, he has consulted for both national and private oil companies. Previously, Hollywood worked 18 years for ARCO International Oil & Gas in exploration and planning roles. He has a BS in geology from Stanford University, an MS in geology from the University of Southern California, and an MBA from UCLA.
