Petroleum coke production from US refineries will increase
The production of petroleum coke by US refineries will increase due to a greater demand for transportation fuels and the deteriorating quality of crude oils processed.
The quality of the additional petroleum coke should be fuel grade (green coke) due to limited markets for anode and needle coke.
The availability of existing and additional quantities of fuel-grade coke provides a source of low-cost energy and chemical raw material to the US chemical and utility power industries. The use of fuel-grade coke in these industries only depends on the ingenuity of the potential user.
This article reviews the trends in coke capacity, production, and exports in the US.
Capacity
As of Jan. 1, 2003, the US Department of Energy's Energy Information Administration (EIA) reported 141 US refineries were operating with 17.385 million b/sd of crude distillation operating capacity.
Fifty-six of the operating refineries, which account for 10.954 million b/sd of crude capacity, have coking units. These refineries are mostly medium and large complex facilities.
Petroleum Administration for Defense District (PADD) 3 contains 23 refineries with coking capacity. The next largest group, 14 refineries, is in PADD 5. For a diagram of the PADDs, see OGJ, July 30, 2001, p. 62.
Table 1 shows coker capacity by PADD.
US refineries use three types of coke-processing technology: delayed, fluid, and Flexicoking. Most US coking facilities are delayed cokers.
The 56 refineries with cokers contain 58 coker units. There are 52 delayed cokers, 4 fluid cokers, and 2 Flexicokers in US refineries.
Two refineries have more than one coking unit. ExxonMobil Corp.'s Baytown, Tex., refinery contains a 42,000-b/sd delayed coker and a 42,000-b/sd Flexicoker. Shell Oil Products Co.'s Martinez, Calif., refinery has a 26,000-b/sd delayed coker and a 22,500-b/sd Flexicoker.
The 10 largest US refining companies operate 41 of the delayed cokers that represent 78% of the total petcoke feed capacity.
The 56 operating refineries do not include three companies that produce needle coke.
US petroleum coke production
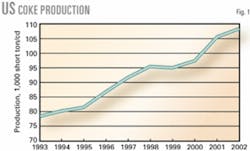
Petroleum coke produced by US petroleum refineries has increased about 38% during the past 10 years even though crude runs have increased only about 9.8%, or about 1.33 million b/cd.
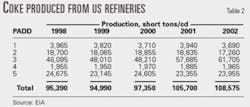
Fig. 1 shows a 10-year history of green coke production. Table 2 shows coke production from refineries grouped by PADD.
Because refineries in PADD 3 represent nearly 55% of US coking capacity, it is reasonable to expect that those refineries will be the leaders in petcoke production. The heavy fuel oil market is limited in PADD 3; therefore, refineries in the district have installed coking units to help reduce production of heavy fuel oil when they are increasing the quantity of lower-quality crude oils being processed.
The 2002 coke production of 108,575 short tons/day (st/d) from US petroleum refining operations represents 84.3% of coke capacity.
The average daily production values show what the historical trends in coke production are within a PADD during the past 5 years. Monthly variations, however, in coke production are what really occurs and are due to:
- Crude slate changes.
- Product slate changes.
- Scheduled downtime for maintenance.
- Unscheduled downtime, equipment failure, power failure, etc.
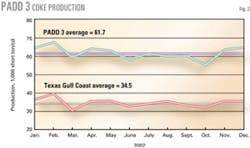
PADD 3 had a monthly average coke production of 61,700 st/d in 2002 (Fig. 2). The lowest monthly production occurred during October at 55,500 st/d. The highest monthly production was in February at 67,800 st/d.
This spread in coke production was probably due to operations in cokers in the Texas Gulf Coast region. The 12 cokers in this region produced about 56% of the total coke in PADD 3 in 2002. And in March 2002, several major Texas Gulf Coast refineries were shut down for scheduled maintenance, which led to the lower coke production.
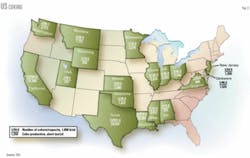
Fig. 3 shows total petroleum coke capacity as of Jan. 1, 2003, and estimated 2002 coke production by state.
Petroleum coke production expressed as short tons of coke/1,000 bbl of crude capacity increased nearly 26% during the past 10 years. At least one coker was installed each year between 1991 and 1998.
Because there were no new cokers installed in 1999, petcoke production was slightly lower than in 1998.
Two new cokers came online in 2000, which increased PADD 3 coke production by 2.5% compared to the previous year. And in 2001, two more delayed cokers came online in PADD 3. They were at ExxonMobil's Baytown, Tex., refinery and Marathon Ashland Petroleum LLC's Garyville, La., refinery.
Future production
One of the driving forces for more coke production is the decreasing quality of crude processed by US refiners.
The quality of processed crudes has decreased steadily during the past 10 years, at a rate of about 0.1°API/year (OGJ, Nov. 18, 2002, p. 40). During the past 5 years, however, the trend has accelerated; the decrease in quality has averaged about 0.19°API/year.
If the trend continues and additional downstream processing units are installed to increase the conversion of the bottom-of-the-barrel fraction into light transportation fuels, US refineries could easily produce 114,500 st/d of coke in 2005.
One new delayed coker and the expansion of an existing coker will be complete in 2003. Valero Refining Co. is planning to start up a 45,000-b/d delayed coker in its Texas City, Tex., refinery (OGJ Online, Feb. 6, 2002). Frontier Refining & Marketing Inc., El Dorado, Kan., is planning on expanding its existing delayed coker (OGJ Online, Feb. 20, 2002).
ConocoPhillips agreed to purchase parts of Premcor Corp.'s idle refinery in Hartford, Ill. (OGJ Online, Apr. 21, 2003). The purchase includes a 17,500-b/sd delayed coker that can produce 960 st/d of coke. This purchase should allow ConocoPhillips to process lower gravity, lower-cost crudes in its Wood River, Ill., refinery.
The sulfur level in green coke is the main indicator of the end market in which the coke will be used. Coke with a sulfur content <2 wt % is usually routed to anode production. Some coke with a sulfur content of 2.01-3.00 wt % is blended with low-sulfur coke and also used to produce anodes.
Coke with a sulfur content of 2.01-5.00 wt % is usually routed to calciners, boilers, and special applications in cogeneration facilities.
The average sulfur content in 2002 was 4.33 wt % in PADD 3, 2.39 wt % in PADD 5, and an average of 3.76 wt % for the entire US.
The sulfur in coke will probably increase due to higher-sulfur crudes processed by US refiners.
During the past 10 years, the sulfur content of US-processed crudes has increased an average 0.036 wt %/year (OGJ, Nov. 18, 2002, p. 40). This trend has moderated during the past 5 years, which indicates that US refiners imported crudes with lower sulfur contents compared to the 1993-97 period.
Exports, imports
US refineries exported about 62% of its petcoke in 2002. This is an increase from the 5-year average of about 59.8%.
Although US industries are using more petcoke as a low-cost energy source for chemical feedstocks or power generation, US coke production is rising at a faster rate than US consumption.
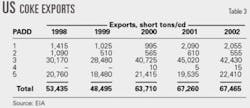
Table 3 shows the 5-year pattern of coke exports by PADD. In 2002, these exports of green fuel-grade coke, calcined coke, and needle-grade coke were 59,985 st/d, 9,610 st/d, and 870 st/d, respectively.
Seven countries received more than 59% of US coke exports in 2002. The major importer is Japan, which imports nearly 100% green coke and a trace of premium coke. The seven top importing countries use the green fuel-grade coke in their processing industries and as boiler fuel.
Owners of refineries outside the US are installing more cokers due to the greater demand for light transportation fuels and poorer quality crudes being processed. This should reduce US exports.
The US imports a limited amount of green coke to meet specific product quality demands of its calcined coke. In 2002, the US imported a record 3,752 st/d of green coke.
Refinery use
Some refineries that produce petcoke use some or all of it as a solid fuel source to generate steam and, more recently, in new cogeneration facilities. Over-the-fence sales of petcoke to cogeneration facilities adjacent to refineries are not included in the data for petcoke used by refineries.
The author
Edward J. Swain is an independent consultant in Houston. He is retired from Bechtel Corp., where he was a process planning engineer. Before joining Bechtel, he worked for UOP LLC and Velsicol Chemical Corp. Swain holds a BS in chemical engineering and an MS in business and engineering administration, both from the Illinois Institute of Technology, Chicago.


