Mud gas isotope logging (MGIL) assists in oil and gas drilling operations
Advances in sampling and analytical techniques now permit the isotopic analysis of very small amounts of hydrocarbon gases in air that are collected from the circulating mud stream during drilling.
A new technique has been developed that employs established geochemical interpretations of carbon isotopic variations in light hydrocarbons to interpretation of shows and other characteristics of the well. The authors1 2 have termed this technique mud gas isotope logging (MGIL).
The technique is differentiated from other geochemical technologies in that a detailed geological and reservoir engineering interpretation is applied to the data. MGIL helps validate hydrocarbon-charged intervals identified by standard mud gas or wireline techniques, assess vertical reservoir compartmentalization, and identifies possible bypassed or low-resistivity pays.
Benefits for regional exploration are assessment of sealing intervals, charge history, and thermal maturity of hydrocarbons.
The MGIL technique significantly improves on standard mud-gas chromatographic compositional analyses and interpretations by incorporating associated genetic isotopic information about the hydrocarbons comprising the show or background. The technique provides essentially identical isotopic information typically collected by expensive static conventional wireline or production test samples, however MGIL samples are a fraction of the cost and can profile samples throughout the well.
MGIL requires essentially no additional rig time for sample collection, nor does it interrupt the normal rig workflow. Equally important, MGIL provides "insurance" against drilling problems that result in a lost well or incomplete downhole formation appraisal.
Because the samples are taken during drilling, they are available for analysis should well problems result in an incomplete wireline logging or sampling program. The technique is relatively inexpensive and easily accommodated on drilling rigs. This is the first of several articles, and data from one Gulf of Mexico well are used to demonstrate this technology.
Data collection
Sampling
The MGIL technique samples the same gas stream from which conventional mud gases are analyzed.
The technique was developed to use existing onsite well mudlogging equipment and technology. Therefore, little new or additional hardware is required other than a sampling manifold or some plastic tubing and fittings. The gas is sampled from the mudlogging gas flowline.
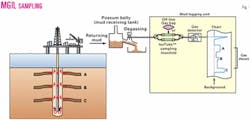
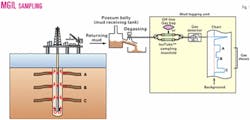
For nonpressurized gas samples collected from the mud stream, aluminum-lined 1-l. bags (e.g., Cali-5-bond3) or metal cylinders (e.g., Isotubes4) are used to collect hydrocarbon gases drawn from the mud gas stream (Fig. 1).
For a frontier basin and-or new field wildcat well, we typically suggest a sampling interval of one sample every 150 ft to establish a background trend. Once a background is established in a field, this spacing may relax to 500 ft or greater on later wells.
During "shows," the sampling interval is increased to about 1 sample/10-30 ft of penetration. Sample bags are filled 1/2 to 3/4 [1-l. volume] capacity in order to minimize problems associated with overfilling and rupturing of the sample bags. Isotubes are metal cylinders and consequently do not suffer from any potential overfilling problems. Once filled, each sample is labeled. Data collected with each sample should include, at a minimum, date, measured depth, and gas units.
When shipping to the analytical laboratory for analysis, it is important to comply with DOT and IATA shipping regulations and protocols, especially for airfreighted samples. The samples may contain potentially explosive concentrations of hydrocarbons; these should be shipped as "dangerous goods." It is possible to calculate the concentration of hydrocarbons in the gas sample from the gas units to determine whether the sample is potentially hazardous.
Analysis
Analysis typically takes 2-4 weeks after sample receipt. For rapid analyses, set-schedule arrangements at the laboratory can be made with samples shipped as soon as they are collected.
Currently being developed and set to debut this year are shore-based (i.e., "onsite") mobile isotope logging instruments designed to improve turnaround time to a matter of hours.5
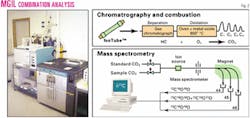
In all analytical schemes, gas sample composition is first analyzed by a gas chromatograph (GC) to determine the appropriate sample size and technique for the isotopic analysis. The isotopic ratios of the different hydrocarbon species are then analyzed using a gas chromatograph-isotope ratio mass spectrometer (GC-irms).
Mud gases released at the surface from the drilling mud form mixtures of predominantly hydrocarbon gases and air. The concentrations of sampled mud gases vary considerably and may show hydrocarbon concentrations close to 0 vol % or as high as 90 vol %.
Depending on individual well mud weighting protocols, typical background trend levels are reflected by hydrocarbon gas concentrations between 0.01 vol % and 1 vol %, while hydrocarbon gas concentrations greater than 2 vol % are generally characteristic of gas shows.
In contrast, gas samples from wireline samplers or production tests are usually uncontaminated by atmospheric gases, so hydrocarbon concentrations are usually quite high. This variability introduces some special issues for the laboratory analytical procedure.
Perhaps the most important consideration in the MGIL technique is data accuracy and precision. Since the MGIL technique provides hydrocarbon gas samples that are often heavily diluted with air, it is important that care be taken to ensure that the laboratory that provides the data uses appropriate standards.
Use of pure gas standards is not recommended. A laboratory absolutely must use recognized natural gas standards (NGS) that have been diluted with air to typical mud gas concentrations. If these analytical protocols are not followed, the laboratory will typically be unaware of bad data and instrument linearity problems at low hydrocarbon concentrations.
Modest cost savings by choosing a low bid lab may result in higher absolute costs because the data will have no value unless proper standards are used. Bad data literally throw money away and may lead to misinterpretations and invalid outcomes, not to mention costly wrong decisions.
Most laboratory carbon isotopic data can be acquired at an analytical precision and accuracy of approximately ± 0.3 ‰. Detection limits associated with online carbon isotopic analyses of methane, ethane, and propane are typically 0.1, 0.06, and 0.04 vol %, respectively (where 1 vol % = 10,000 ppm).
Samples that contain even lower concentrations of hydrocarbon gases may be approached and analyzed if an enrichment technique is used. Some laboratories may effectively analyze samples with concentrations down to levels between 0.0005 to 0.005 vol % for ethane and propane. However, analytical precision and accuracy decreases with enrichment techniques. Fig. 2 shows a schematic of methods employed in the laboratory analysis of gas isotopes.
Costs
In order to control costs, mud gas isotope analysis generally focuses only on the methane, ethane, and propane (i.e., C1-C3) gas components, although the full suite of gas components including butanes and pentanes (i.e., iC4, C4, iC5, C5) may also be analyzed if requested and enough sample is available for measurement.
The great majority of MGIL data interpretation employs only the methane data, with the higher gas components (C2+) used mainly for geochemical interpretation of maturity, source, and gas correlation. The reason for this is that gas samples comprising background intervals (i.e., nonreservoir zones) in wells are typically sourced from low-temperature thermogenic and bacterial origins, in which methane is the dominant, and in most cases the only, measurable gas component. Background hydrocarbons typically have very low concentrations, and heavier hydrocarbon gases (C3+) may not even be detectable.
In a typical exploration well, plan for 70% of the samples to be background samples for which only methane can be analyzed (typical laboratory compositional and isotopic analytical cost = $120). The other 30% may contain higher hydrocarbons, which require more expensive analytical procedures (typical laboratory compositional and isotopic analytical cost = $360).
The sampling devices may be purchased or rented and will typically average $20-25/unit. Knowing the sample spacing and the average laboratory cost per sample based on the expected fraction of background samples, it is possible to estimate an appropriate MGIL budget for a wildcat well.
MGIL data
MGIL provides two types of data: high quality compositional and carbon isotopic data.
The other main gas geochemical analysis tool, hydrogen isotopic ratios, can only be collected from MGIL samples that possess elevated hydrocarbon concentrations of show strength. Fortunately, high quality compositional data and carbon isotopic ratios on methane, ethane, and propane are sufficient to distinguish the origin of most thermogenic gases.
Compositional data collected from MGIL samples are typically of better quality than wellsite chromatographic analyses. The overall compositional trends are analogous to the wellsite chromatography.
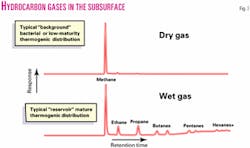
Hydrocarbon gases collected from the mud stream during drilling are typically comprised of methane, ethane, propane, butanes, and pentanes (Fig. 3). Other gases such as carbon dioxide, helium, and hydrogen sulfide may also be detected.
These nonhydrocarbon gases are strongly affected by the mud system, and some components (e.g., carbon dioxide) may even be thermally generated at the bit during drilling, so concentrations may not accurately reflect indigenous subsurface gas compositions. In addition, all mud gas samples are contaminated by atmospheric nitrogen, so mud gas samples are typically not able to evaluate the potential for high nitrogen in hydrocarbon gases unless atmospheric corrections are applied.
Because nonhydrocarbon gas concentrations are altered, the concentrations of hydrocarbon gases are normalized to the percentage of the total hydrocarbons. In most samples, methane will be the dominant hydrocarbon. If methane concentration exceeds 98% of the hydrocarbons, the gas is often referred to as "dry gas," while samples with ethane and heavier hydrocarbon concentration exceeding 2% of the total hydrocarbons are often referred to as "wet gases."
Carbon isotope fundamentals
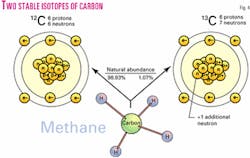
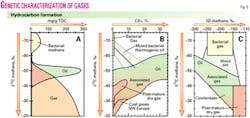
All hydrocarbons contain two natural stable isotopes of carbon, 12C ("light" carbon) and 13C ("heavy" carbon; Fig. 4). The small variations in natural abundance of 13C are expressed in the delta (δ) notation as the part per thousand (per mil, ‰) deviation of a sample relative to the PDB reference standard.6 The ratios of the two isotopes vary with the origin of the gas and the type of hydrocarbon7 (Fig. 5).
Before the carbon isotopes can be used to identify the origin of the gas, the effects of mixing during sampling must be considered. All mud gas show samples contain admixed background gases. Because stable isotope analyses are basically concentration measurements of a rare isotope, carbon isotope ratios in a gas show can be corrected for background contamination. Isotope mass-balance is very simple when expressed in arbitrary gas units (GU) as the concentration measure
δ13CS* GUS = δ13CGS* GUGS
+ δ13CBG* GUBG
Whereby S, GS, and BG designate the sample, the gas show, and the background and
GUS = GUGS + GUBG
In a very simple case the background methane may have an isotope value of δ13CBG = –70 ‰ a concentration GUBG of 10 gas units and gas show may have an isotope value of δ13CS = –50 ‰ and a concentration GUS of 110 gas units. The simple mass balance reveals that the gas show has an isotopic composition of
δ13CGS = –48 ‰
This value is the true value of the methane in the formation gas and can be interpreted in terms of origin unless other mixing processes need to be corrected.
Gas types interpreted from MGIL data
Geochemists recognize three major gas types in sedimentary basins: bacterial (or biogenic) gas, thermogenic gas, and mixed gas. Mud gas origin is interpreted by the same methods as conventional gas geochemical interpretation.
Bacterial gas in the subsurface
Bacterial gas is a product of shallow subsurface metabolism by microorganisms. It can be identified by its isotopically light methane and by the absence or scarcity of higher hydrocarbons.
Depleted or "light" methane isotopic values of –60 ‰ or below are usually attributed to bacterial gas sources. Bacterial gases from the marine environment generally have concentrations of methane at 99.9 vol % (normalized), with ethane and higher hydrocarbons at less than 0.1 vol %.8
Bacterial gas is pervasive in the shallow subsurface in settings with rapid accumulation rate and moderately high organic carbon concentrations. Since bacterial methane does not form readily in deeply buried sedimentary sections, its presence at great depths is generally a consequence of rapid seal development in rapidly subsiding basins (e.g., northern Italy, Gulf of Mexico).
Thermogenic gas in the subsurface
Thermogenic gas is generated from kerogen or petroleum as a result of heating during burial.
Thermogenic hydrocarbon gases typically exhibit "heavier" carbon isotopic values than bacterial gases and the fraction of heavier hydrocarbons is much greater. In general, the carbon isotopic ratio of methane in thermogenic gas ranges from –20 to –60 ‰, and the percent of heavy hydrocarbons relative to total hydrocarbons is up to 50% or more.
Two factors control the isotopic composition, the isotopic composition of the starting material and the temperature at which the gas is generated. Typically, heavier (less negative) carbon isotopic ratios indicate generation in the gas window or generation from coals, whereas lighter carbon isotopic ratios indicate generation in the oil window from marine kerogen.
At very low thermal maturity, thermogenic gas may be compositionally and isotopically similar to bacterial gases. Considering the ethane and propane carbon isotopic ratios in addition to the methane carbon (Fig. 5) can differentiate the source and maturity effects.
Gases migrate in the subsurface, so gases of different origin commonly mix. Bacterial gas in deeper basin settings is commonly mixed with a small component of thermogenic gas that raises the gas wetness while maintaining relatively light carbon in the methane. The intermediate compositional and isotopic character of this gas is often hard to differentiate from early thermogenic gases.
Using MGIL for well interpretation
Hydrocarbon gases in circulating mud come from three sources: gases in subsurface oil and gas phases, gases dissolved in subsurface pore waters or sorbed on rocks, and gases recirculated into the borehole with mud where the mud has not completely degassed in the mud pit.
Mud gas shows are identified where hydrocarbon concentrations in the mud gas are high. Shows usually indicate a high saturation of gas or oil phase in the subsurface reservoir, but changing drilling conditions, penetration of source rocks or coals, or penetration of low-saturation hydrocarbon reservoirs may also cause them.
Low hydrocarbon concentrations are just about always present in circulating mud during drilling; this is referred to as the background trend. Background hydrocarbons come from a combination of hydrocarbon dissolved in water, hydrocarbons sorbed on rocks, and hydrocarbons recirculated with the mud.
Where mud is not properly balanced, mud gas shows may not appear when penetrating a petroleum reservoir, or shows may appear when no subsurface oil or gas phase is present. For this reason, mud gas shows are usually confirmed by other methodologies, such as wireline log analysis or cuttings analysis. Shows suppressed by overbalanced mud systems may not be recognized as such, so potential pays may be unrecognized.
Show identification
MGIL provides a way of verifying mud gas shows and detecting possible bypassed pays.
Economic concentrations of gas and oil are usually generated deeper in the basin and migrate into the reservoir, whereas background gases are mostly indigenous. This means that the isotopic composition of gas in the reservoir is likely to be different from that of the background.
Traditional gas shows associated with a significant isotopic shift indicate that the show is caused by migrated gas. Shows without an isotopic shift from background are probably not migrated gases, so these shows may be caused by changes in drilling conditions, not the presence of migrated petroleum.
Like conventional mud gas shows, the presence of heavier hydrocarbons in the show can indicate the type of petroleum in the reservoir. Oil may be suggested by a higher abundance of C3+ components (notably pentanes and hexanes), whereas wet gas is associated by a dominance of ethane. This can be confirmed by evaluating the carbon isotopic content of the higher hydrocarbons to determine if their isotopic composition is consistent with that of the methane and with each other.
Distinguishing the type of petroleum (i.e., oil from gas) in a reservoir is also possible through construction of a calibration database in which known gas-liquid production is related to hydrocarbon gas isotopic properties. Such an MGIL database has been successfully employed in differentiation of oil versus gas and in predicting downdip oil potential.
Although MGIL verifies shows and identifies potential bypassed pays, it cannot distinguish saturation in high permeability reservoirs from residual saturation or low saturation migration pathways. Producibility must be evaluated by more traditional production testing, wireline testing, or wireline log analysis.
Interpreting MGIL background isotopic trends
In order to recognize hydrocarbon charge in a reservoir, the background trend must be established.
A well-defined background gas trend is also necessary to properly correct the show isotopic composition. The background isotopic trend is identified where a series of compositional and isotopic data follow a uniform trend with depth.
In wells with numerous shows, the background is constructed by omitting the data from the show intervals. These background data are generally characterized by low total hydrocarbon gas and light carbon isotopic ratios relative to shows.
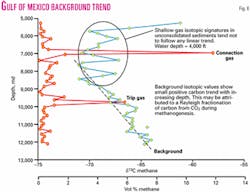
Most background methane becomes isotopically heavier with increasing depth (Fig. 6). Some background trends have almost constant carbon isotopic composition, whereas others may span ten per mil or more.
The origin of the background trend is still somewhat controversial. This trend could be caused in immature sediment sections with bacterial gas formation by a Raleigh fractionation during methanogenesis, as described in ODP literature.9 10 In deeper sections, it could represent the progressive generation of heavier methane gas by thermogenic cracking of indigenous kerogen.
In zones charged by migrated petroleum, diffusion of dissolved light hydrocarbons shifts the background trend to heavier values. The drilling process itself may even influence some of the background trend. Gas from earlier-penetrated shows may be smeared through deeper sections where mud does not completely degas in the mud pit or where gas bleeds through the filter cake.
Because of its multiple origins, background trends may suddenly shift with depth. Where parts of the background trend are indigenous and part due to admixed migrated petroleum, this shift may indicate a seal that limits migrated petroleum charge to part of the stratigraphic section. The top seals to geopressured zones may separate dissolved methane with different isotopic ratios, so in some cases, the background shift is related to geopressure.
Where significant seals are lacking, the background trend mixes with the migrated petroleum and may form an irregular, isotopically heavier background trend. Background shifts may also indicate change of dispersed kerogen type (indicating major change in depositional environment) or a major increase in thermal maturity across an unconformity.
MGIL estimates
Thermal maturity and bacterial content of gases
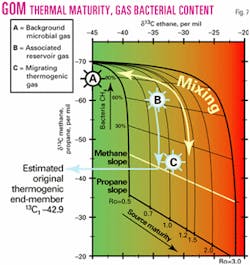
Gas thermal maturity and bacterial gas contribution can be estimated where carbon isotopic ratios for the methane, ethane, and propane gas components are available (Fig. 7).
Two isotopic ratios (methane and propane) are plotted on the Y-axis, and ethane isotopic values are plotted on the X-axis for the same sample. Two data points will therefore result for each plotted sample, with one data point representing methane against ethane, and the other, propane against ethane.
For gases with no bacterial contributions, points should plot on their respective isotopic maturation trends (highlighted in green and blue).1112 Since bacterial gas contributes mostly isotopically light methane, any methane /ethane data point deviating above the methane trend (green slope) will indicate addition of a bacterial component.
The distance above the trend can be converted into a percentage bacterial component added to the gas. The isotopic composition of the thermogenic methane component can then be calculated, and the thermal maturity of the sample estimated from the methane isotopic composition of the thermogenic component. Thermal maturity can also be interpreted directly from the ethane-propane isotopic trend.
The deconvolution of mixed samples and the estimate of the end-member composition can be best demonstrated using a "real-world" example. Table 1 lists isotopic data for three gas samples found in one GoM well which are also plotted on Fig. 7. Sample B is estimated to contain approximately 65% bacterial gas from the cross plot, whereas even sample C contains about 10% bacterial gas.13
The large bacterial gas signature in many GoM gases is the result of GoM oils being largely undersaturated. Hence, it is expected with these oil types that free bacterial gas (i.e., reservoired gases) and perhaps bacterial gas dissolved in water will partition into the oil as it migrates and charges a reservoir.
Interestingly these data reveal that migrating oil and gas, as exemplified by the sampled fault gas, possess a dominantly thermogenic gas isotope character, although a very small bacterial component (estimated at less than 10%) also appears to have been incorporated during migration.
For the fault gases shown in Fig. 7, the estimate for the original (i.e. removal of small bacterial component) thermogenic methane isotope value is about –41.1 ‰, suggesting the fault gases are slightly more mature than the earlier migrating gas which charged the reservoir.
These methane data are therefore also in agreement with the associated isotopically heavier ethane and propane data of the migrating thermogenic gas. Since the estimated thermogenic component of the fault gases and reservoir gases are similar, it may be suggested that gases in the GoM may actually be acquiring the bulk of the absorbed bacterial signature in the reservoir and not along the migration pathway.
As long as the oil remains undersaturated, then thermogenic gas cogenerated with the oil should not be able to leave the oil. Therefore, the presence of a definite thermogenic component to the gas should indicate that an oil phase is present. If oil is heavily diluted with bacterial gas, then it is theoretically possible that oil will contain what appears to be an entirely bacterial gas component.
Most suspected GoM oil-prone intervals show distinctly higher fractions of thermogenic gas with the ratio of thermogenic to bacterial gas varying from reservoir to reservoir. For the GoM reservoir hydrocarbon gases shown in Fig. 7, the estimate for the original thermogenic methane isotope value is –42.9 ‰. This compares favorably with the measured bacterially-corrected d13C1 value of –41.1 ‰ (original uncorrected value = –44.42 ‰) considered representative of the present-day migrating thermogenic gas.
From the plots shown in Figs. 5 and 7, it would be observed that the reservoir hydrocarbon gases were generated in the late oil window and are likely to have been originally associated with oil (as was the case!).
Summary
The MGIL technique provides detailed downhole isotopic logging and delivers to the geoscientist unparalleled geochemical perspective on the geological environment and hydrocarbon charging/filling history.
MGIL information had been shown to provide short and intermediate direct benefits to exploration and production and is inexpensive and easily accommodated on drilling rigs. Most importantly, MGIL sampling of mud gases while drilling provides for inexpensive insurance against unforeseen drilling problems that may result in a lost hole or prevention of subsequent logging.
In a business where economics is the bottom line, MGIL maximizes information derived from each well and assists in developing accurate exploration and production prognoses on future prospects.
References
1. Ellis, L., Brown, A., Schoell, M., and Haught M., "Mudgas isotope logging while drilling: A new field technique for exploration and production," abs., 19th International Meeting on Organic Geochemistry, Istanbul, Sept. 6-10, 1999, Part 1, pp. 67-68.
2. The term MGIL is trademarked and a patent application has been filed for the interpretive technique. More information on the technique may be found at Terra Nova Technologies, PMB 533, 18352 Dallas Parkway, Ste. 136, Dallas, TX 75287 (www.terranovatech.net).
3. Calibrated Instruments Inc., 200 Saw Mill River Rd., Hawthorne, NY 10532 (www.calibrated.com).
4. Isotech Laboratories Inc., 1308 Parkland Ct., Champaign, IL 61821-1826 (www.isotechlabs.com).
5. Isotope Logging Inc. (ISOLOG), 206 Hyde Park Dr., Richardson, TX 75080 (www.isotopelogging.com).
6. Because these concentration variations are very small, they are reported in so-called d-values which are concentration differences in ‰ relative to a standard where d = (Rs/Rst-1)*1,000 and Rs and Rst are the 13C/12C ratios of sample (s) and standard (st), respectively. Note that all d-values of natural gas hydrocarbons are negative. This is a result of the (historical) choice of the international P.D.B. standard, a marine carbonate. All organic materials including natural gas are depleted in 13C because photosynthesis and following reactions tend to discriminate against the heavy 13C isotope.
7. Schoell, M., "Genetic characterization of natural gases, AAPG Bull., Vol. 67, 1983, pp. 2,225-38.
8. Rice, D.D., "Biogenic gas: controls, habitats, and resource potential," in "Future of Energy Gases," Howell, D.G., ed., USGS Professional Paper 1570, US Government Printing Office, Washington, DC, 1993, pp. 583-606.
9. Claypool, G.W., and Kaplan, I.R., "The origin and distribution of methane in marine sediments," in "Natural Gases in Marine Sediments," Kaplan, I.R., ed., Plenum Press, New York, 1984, pp. 99-139.
10. Berner, U., von Breymann, M.T., Faber, E., and Bertrand, Ph., "Gas Geochemistry of ODP sites 767 and 768, Celebes and Sulu Seas," in "Bacterial Gas," Vially, R., ed., Editions Technip, Paris, 1992, pp. 147-156.
11. Faber, E., "Zur Isotopengeochemie gasfoermiger Kohlenwasserstoffe," Erdoel Erdgas Kohle, Vol. 103, 1987, pp. 210-218.
12. Rooney, M., Claypool, G.E., and Chung, M.H., "Modeling thermogenic gas generation using carbon isotope ratios of natural gas hydrocarbons," Chemical Geology, Vol. 126, 1995, pp. 219-232.
13. The calibration dataset used in construction of the "Schoell plot" is not universal and representative for all gas types. Gases from some basins not included in the calibration dataset do appear to correlate with separate and distinct maturity calibration trends. This is attributed to precursor organic matter variations in parent source rocks.
The authors
Leroy Ellis ([email protected]) is president of recently formed Isotope Logging Inc. and managing director of Terra Nova Technologies LLC (www.terranovatech.net), a Dallas oil and gas consulting firm. He moved from Australia to undertake postdoctoral studies on heavy oil characterization at Argonne National Laboratory's Coal Chemistry Group before joining the former ARCO as an exploration research geochemist. He has a BSc in chemistry, honors I in synthetic organic chemistry and a PhD in organic geochemistry from Curtin University of Technology.
Alton Brown, a consultant in Richardson, Tex., worked 20 years at the ARCO technology center in Plano, Tex. Most of his work involved petroleum migration, hydrodynamics, and source rock evaluation, chiefly in exploration support. He has a PhD in geology from Brown University.
Martin Schoell, with Isotech Laboratories Inc., Champaign, Ill., is a former San Ramon, Calif., consultant who works mostly with ChevronTexaco Corp. affiliates on large regional studies in petroleum and natural gas geochemistry. He worked 13 years at the German Geological Survey and joined Chevron Petroleum Technology Co. in 1984. He has a PhD from the University of Clausthal and obtained a lecturer degree (habilitation) in 1983 from the University of Bochum.
Steve Uchytil is a geological advisor with Amerada Hess Corp. in Houston, working the Equatorial Guinean offshore. He has 23 years of exploration experience primarily in the Gulf of Mexico, Alaska, Michigan, and California, the majority acquired while at ARCO-Vastar.
