Type-well analysis improves decline curve estimation
Arafa al Harthy
Riyadh al Jarwani
Petrogas Rima LLC
Oman
Martin Soh
Consultant
Canning Vale, Australia
Saleh al Jabri
Daleel Petroleum LLC
Oman
Year-on-year stability in remaining proved-developed reserves (1P) is the most positive impact of applying a consistent type-well approach to 1P estimates. Operators can then better forecast future cashflows and confidently justify additional development.
The type-well approach described in this article minimizes judgment aspects of the decline curve analysis (DCA) method and emphasizes systematic workflows. Stakeholder ownership of a company's 1P reserves can grow when the technical and commercial segments of the business have a better understanding of the basis of these figures.
Oil well DCA is a useful tool for estimating remaining reserves. As an empirical method, DCA requires historical production data, but it can be performed without simulation models. DCA also can be a simpler tool than simulation models, especially when operators may not have the resources or data available to build models. Production volumes are too small in some fields to justify data collection.
Year-on-year remaining 1P estimate upgrades are a symptom of chronic underestimation. This article uses oil field case study examples to demonstrate a type-well method capable of providing compliant 1P estimates. This simple, systematic method relies less on subjective judgment than do simulation models and can be applied to both producing and future wells.
DCA principles
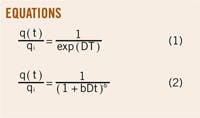
Exponential, hyperbolic, and harmonic declines are used to estimate ultimate recovery. Equations 1 and 2 express these declines (see box). The difference in estimation relies on the exponent for "b" (or the "b" factor):
• b = 0 for exponential.
• 0 < b < 1 for hyperbolic.
• b = 1 for harmonic.
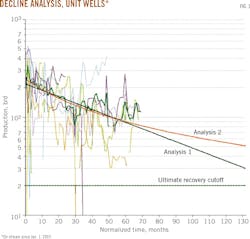
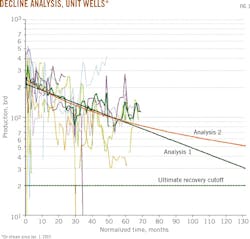
Other factors, such as b > 1, describe the decline of tight-shale gas wells. Q(t) is the rate as a function of time, t; qi is the initial rate (at t = 0); and D is the decline rate. DCA charts (Fig. 1, Table 1) are typically plotted log q vs. t or N (cumulative production). The straight line decline is exponential (b = 0) and the curved line is hyperbolic-harmonic. Two P50 best fit decline functions are fitted with b = 0 for Analysis 1. Analysis 2 allows b to vary between 0 and 1. Ultimate recovery is 50% higher for Analysis 2 than Analysis 1.
The implicit assumption for DCA is that the factors causing decline continue unchanged during the forecast period. These factors can include the drainage area and drive mechanism for the reservoir or specific operating conditions, i.e., bottomhole and wellhead pressures and artificial lift.
Any change in operating or reservoir conditions can alter the forecast decline. Because DCA is essentially a data fitting exercise based on observations of well production, no prescribed rules exist as to which b factor should apply. Exponential decline (b = 0) is the most conservative rate, although under certain assumptions, it is equivalent to steady-state boundary dominated flow conditions. Hyberbolic-harmonic decline (0 < b ≤ 1) can occur where there is transient energy support. Transient energy's effect is much more pronounced in shale, tight gas reservoirs (b > 1) due to ongoing matrix-fracture interaction during the production timeframe. But if decline becomes exponential upon reaching steady state, the question becomes "when will steady state be reached?"
Reserves, resource management
Reserves are related to future cashflow and profitability. Future cashflow can be derived from already producing assets (developed reserves), or assets that will produce after development (undeveloped reserves). This definition is forward-looking and does not take into account prior development expenditure. A project expected to have negative cumulative cashflow, and hence no reserves at financial investment decision can have reserves associated in the future, as costs are sunk and the forward cumulative cashflow becomes positive.
The petroleum resource management system (PRMS) categorizes reserves by the degree of certainty in the estimate. The three estimate categories include:
• Proved (reasonable certainty).
• Probable (less certainty than proved, but more than "possible" reserves).
• Possible.
This definition does not explicitly define reasonable certainty, but guidelines are available as to what constitutes reasonable certainty as well as proved, probable, and possible reserves. Other criteria that must be satisfied to classify a resource as a reserve include commerciality, technical maturity, and a discovered test.
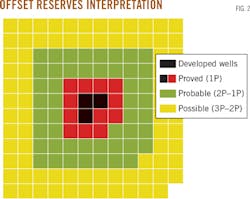
Operators may determine reserves classification using the area offset method. This method classifies reserves depending on the offset distance from an existing producing well. The closer a proposed well location is to the producing well, the higher the certainty allocated to its reserves. Fig. 2 illustrates an application of the offset methodology. Well locations one offset from an existing producer are classified as 1P, those within three offsets are classified as proved + probable (2P), and within five offsets as proved + probable + possible (3P) reserves. The number of offsets varies between practitioners depending on interpretation and judgment.
The proved area defined by the offset method can be rather small, making 1P sometimes much smaller than 2P. Proved reserve areas can be extended with reliable technology.
High decline
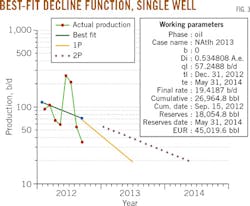
A longstanding practice has been to judge general well decline and use the function to estimate remaining 2P reserves and then apply a higher decline factor (typically 30%) to estimate remaining 1P reserves (Fig. 3). The 1P decline factor will underestimate remaining reserves. This problem is exacerbated year on year, with additions made to 1P reserves as the well consistently outperforms the conservative decline curve.
While annual additions to 1P reserves benefit investment terms, they do not help operators accurately project future cashflow and profitability. In fact, the value of the operation is chronically underestimated, unnecessarily impeding its ability to raise finance, and potentially resulting in suboptimal field development.
No observable declines
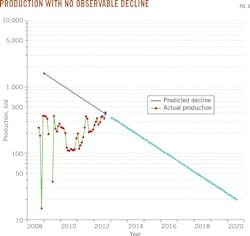
Sometimes the oil well does not exhibit a clear decline trend (Fig. 4). In this example, the estimator has implemented a decline curve vaguely based on 2009-11 decline. The main concern with this approach is that the reservoir and operating conditions which led to the observed decline may not be applicable in estimating the well's future decline.
Undeveloped production
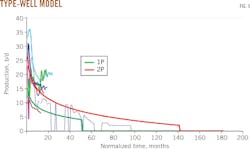
Undeveloped wells have no past production performance. But a decline curve function is required to estimate their future production contribution. Type wells or "conduit models" are typically used to estimate undeveloped well production. These models are derived from appropriate analogue well data taken from the same reservoir or well architecture (Fig. 5). The estimator's judgment determined 1P and 2P decline functions.
Discounting the 1P type well model again leads to severe underestimation of ultimate recovery (UR). Such undeveloped wells may not be economic, as is the case for the example shown in Fig. 5.
Best-fit decline
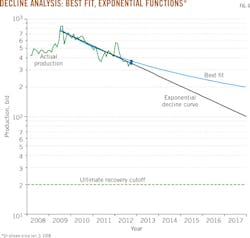
Engineering and technical judgment determine the b factor selected, which can vary precisely because of the subjective nature of the analysis. Fig. 6 and Table 2 show production performance of a well that has been onstream for a few years. A decline trend is evident, and functions were fitted to all data after the 2009 post-production peak. Projected remaining UR varies widely depending on the function chosen. The best-fit function has b = 0.992 and remaining UR = 2.4 million bbl, while the exponential function (b = 0) has remaining UR = 0.5 million bbl. Both functions are valid estimates, and other solutions are possible depending on the estimator's assumptions and the degree of reservoir understanding.
This example applied severe decline factors (b = 0, exponential) for remaining 1P reserves and less severe decline factors for remaining 2P and 3P reserves. The choice of b factor is at the discretion of the estimator.
Solving underestimation problems
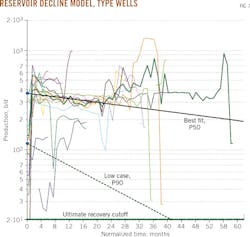
Type wells provide a robust solution to the problems encountered when using DCA to estimate remaining reserves. The type-well dataset can be grouped by reservoir unit, artificial lift method, completion type, and orientation -horizontal, vertical, or deviated-to derive a type-well forecast. This forecast is a fit of all historical well production performance in the set. More historical data, especially long production histories, will provide more confidence in the b factor applied to forecast long-term type well production (Figs. 1 and 5).
Estimating undeveloped wells
Beyond b factor, the additional consideration for undeveloped wells is the initial rate estimate. Initial rate and b factor can be fitted to historical production data as "best fit," "P90," or "P10," and commercial software packages are available to automate the fitting process.
The type-well technique enables estimators to derive a variety of curves for undeveloped well performance. Fig. 7 and Table 3 show best-fit and low-case decline functions superimposed on a set of historical production data. There are limitations in the type-well functions as shown, however, where well performance after 20 months of normalized production deviates from the 2P function.
Low, mid, high models
These best-fit and low type-well derivations forecast the 1P, 2P, and 3P cases' production of future undeveloped wells in an attempt to quantify uncertainty and estimate low and mid-reserves outcomes. There are significant issues with this approach.
DCA is a deterministic methodology. The workflow obtains a best fit to the data. A P50 or average type-well fit is plausible, but how is fitting a P90 or P10 type well consistent with obtaining a best fit? What does the P90-P10, low-high type well mean?
The type-well method is inherently conservative-especially when applying exponential decline (b = 0). Even when hyperbolic decline is applied, the reserves range (b = 1-0) remains quite narrow unless the decline factor is high (>40%).
Type-well fit for P90-P10 low-high is unclear as is how to derive the type-well functions. A P50-average fit is a best fit to the type-well input data. DCA that estimates undeveloped reserves with b = 0 is conservative. The P90 type well in Fig. 7 would be more conservative. Potential errors in estimated reserves are exacerbated when the undeveloped 1P reserves production forecast is calculated with a low model offering a reserves estimate that can be cited as too low. Future cashflows and value are underestimated, and the remaining 1P reserves rise over time.
It is common in these circumstances for the 1P reserves replacement ratio to be >100%.
The choice of b factor also needs consideration. Setting the initial rate and changing the b factor can also yield low, mid, and high type-well decline functions. Commercial software packages can calculate best fit to the input data using initial rate, decline (%), and b as variables.
B-factor fit has an impact on short-term future production, only if the decline rate is high, in which case the impact of b is predominantly long-term. Confidence in long-term performance depends on production history. Where a trend is observable, higher confidence may be inferred.
Application, no observable decline
The type-well functions defined may be used to estimate future productivity of the well in Fig. 4 by applying its decline rate beyond the last production-rate data point. This can be more representative than fitting a decline function over a production period where a trend is observable. The latter method has a bias to overestimate future well decline, being judgment-based and therefore more prone to visually identify high vs. low decline periods.
Fig. 4 shows 2009-10 production decline of about 50% compared with best fit type-well decline of 12%, the latter assuming exponential decline. Decline rate or b factor choice can use P90, P50, P10, or another method.
The utility of type wells in predicting initial rates and (short-medium term) decline does not necessarily depend on the amount of historical data available. Recent on stream wells will affect the initial rate estimate, and wells that have been producing for longer periods will affect annual decline.
DCA for proved reserves
For determining proved undeveloped reserves, b = 0 is recommended to estimate production with the best fit type-well function. Methods such as simulation can assist in estimating 2P and 3P reserves if required.
Applying reliable technology, such as contacts or seismic, can meet the proved-area requirement. Otherwise, the offset method will place some future development wells outside the proved area.
Best fit type-well functions also can estimate proved reserves' future annual decline for producing wells where no decline is observable. For wells where a clear decline trend is observable, the best-fit exponential function can estimate remaining proved reserves.
The average annual decline for all developed reserves production forecasts will almost certainly exceed the type-well decline. It is easier to identify higher decline than lower decline, making the method inherently conservative and justifying the proved-reserves classification.
Conditions, benefits
Type-well DCA works best when the reservoir and operating conditions remain steady, including:
• Pressure support-maintenance (water flood, water injection).
• Well architecture.
• Reservoirs targeted by future wells, avoiding skewed data from recompletions.
Caution must be taken in other situations. The decline rate for undeveloped wells, for example, can be estimated using drainage-radius and material-balance calculations in situations where the development plan assumes depletion.
The proved area also needs justification when operators extend the offset-area definition. Reservoir properties outside the offset area need to function similarly to the immediate reservoir inside the offset area.
The authors
Arafa al Harthy ([email protected]) is subsurface manager at Petrogas Rima LLC, Azaiba, Oman. He has also served in various roles with Petroleum Development Oman (PDO), Norsk Shell, Daleel Petroleum LLC, and Occidental Corp. He holds a BS in geological engineering from the Colorado School of Mines, Golden, Colo.
Martin Soh ([email protected]) is a reservoir modeling and monitoring consultant working with various operators globally. He has also served as reservoir engineer with Royal Dutch Shell PLC, Woodside Energy, and BHP Billiton Ltd. He received the Clough Ltd. Fullbright Fellowship in engineering hosted at the University of Minnesota, Twin Cities. He received his PhD from the University of Western Australia, Perth.
Riyadh al Jarwani ([email protected]) is cluster leader at Petrogas Rima. He has also served as a reservoir engineer at PDO. He holds an MSc in petroleum engineering from Heriot-Watt University, Edinburgh, UK, and a BEng in control systems engineering from Sheffield University, UK.
Saleh al Jabri ([email protected]) is Natih field team leader at Daleel Petroleum LLC. He has also served as reservoir engineer at PDO. He holds an MSc in petroleum engineering from Heriot-Watt University, and a BSc in petroleum engineering from Sultan Qaboos University, Al Khoudh, Oman.
