Upstream employment rises with exploration
The number of US jobs related to oil and gas production, drilling, and services rose 7.3% in 2004, the result of a continued upswing in domestic exploration activity. It represents the fifth employment increase in the oil and gas sector since 1989, but structural declines in oil and gas-related employment seem likely to dominate in the future.
Regional changes in oil and gas activity and employment accompanied the 2004 US job increases. Specifically, Texas, New Mexico, and the Rocky Mountain states have emerged as winners, while the oil-bearing offshore and Midcontinent regions have lost out.1
This article examines recent trends in US oil and gas-related employment within the context of longer-term developments in the industry. The ability to compare employment across time and regions is complicated by lags in government data releases and recent changes to rules governing both industry classifications and metropolitan statistical definitions. Even so, the available data tell an interesting story about upstream energy employment through 2004.
National trends
The Bureau of Labor Statistics (BLS) provides employment data on three relevant upstream energy sectors: oil and gas extraction, drilling, and oil and gas support. These correspond roughly to the industry terms of production, drilling, and oil services, respectively.2 One can reasonably aggregate the BLS drilling and support series, leaving two segments of employment: extraction (production) and drilling and support (drilling and services).
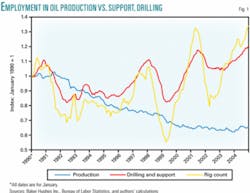
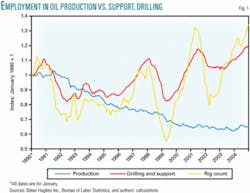
While drilling and support generally track cyclical trends in rig activity, employment in the extraction sector was in a near-constant decline during 1983-2003, with 1991 the only (modest) exception (Fig. 1). The strong 7.3% increase in total upstream employment in 2004 (measured December to December) was widely noted as the first in years. Production-related jobs rose 5.4%, and the sum of drilling and support service jobs rose 8.6% (OGJ, Jan. 14, 2005, p. 34).
Prior to the 2004 gains, the total upstream industry saw cyclical increases in 1990, 1993, 1996, and 1999. The Baker Hughes rig count has reached 1,000 working rigs four times since 1989: in April 1990, January 1998, October 2000, and April 2003. The average industry employment corresponding to each date was 359,300, 322,600, 301,000, and 298,200, respectively, indicating that the industry has learned to do more with fewer workers. However, the data also make clear that most of the gains in output per worker in recent years have been concentrated in the producer sector, which follows a long downward trend. Drilling and support have tended to follow the drilling cycle much more closely.
Throughout the US economy, productivity gains have been the enemy of short-run employment gains. Since the last peak in production in the fourth quarter of 2000, gross domestic product (GDP) has risen 11.2%, while nonfarm establishment jobs have not grown at all. January 2005 saw the number of jobs in the US economy finally match the previous employment peak, ending over 3 years of jobless recovery.
With no new jobs, the increase in output has been covered by growing output per work hour. Nonfarm productivity grew just 1.4%/year on average during 1973-90 but surged to a 2.5% annual rate after 1990. Over the past 4 years, with job growth stalled, economy-wide productivity gains accelerated to 3.9%.
Throughout the 1990s, the oil and gas industry has been a leader in productivity improvement. Output per oil and gas worker surged 3.6%/year from 1990 to 2002, well ahead of the 2.2% rate in the overall US economy and nearly matching manufacturing’s 3.9% rate. This means that downward pressure on oil jobs due to productivity improvements was more than 60% greater than that on the overall US economy.
What has caused these productivity gains? For the economy as a whole, they are widely attributed to the New Economy-new ways to arrange the workplace and improve production processes made possible by computers, semiconductors, and advances in telecommunications.
The oil industry has been a recognized leader in embracing improvements in materials and technology, such as 3D and 4D seismic methods, drillbit sensors, and horizontal drilling.3 All have improved the industry’s ability to know where to drill, to drill deeper into the earth, and to drill in deeper waters and harsher environments.
But the industry also has benefited from downsizing and outsourcing activities in mundane business areas such as personnel and accounting services. The data suggest that the bulk of these productivity gains have accrued to producers more than to drilling and support services.
Productivity gains likely will continue their dominance of oil and gas employment once the current cyclical peak is past. However, falling employment does not necessarily indicate a declining industry. It may simply be a sign of technological success. Despite falling employment, the upstream oil and gas sector has maintained a 1% share of GDP since 1987.
Regional trends
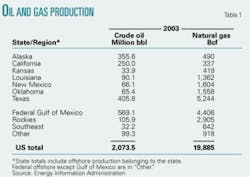
Seven key states-Texas, California, Alaska, Louisiana, New Mexico, Oklahoma, and Kansas-dominate the US upstream industry along with four states in the Rockies: Colorado, Montana, Utah, and Wyoming; three in the Southeast: Alabama, Arkansas, and Mississippi; and the federal offshore area (Table 1). Together these states and regions accounted for slightly more than 95% of US oil and natural gas production in 2003.
The recent regional energy story revolves around two themes: the oil-gas mix and declining offshore activity. The period since 1992 marked a turning point in US production. During the short-lived expansion of June-December 1992, gas-directed exploration overtook oil-directed searches in its share of US activity. In June 1992, about 40.7% of all rigs drilling were targeting natural gas. By the December 1992 peak, 56.5% of drilling was gas-directed. Continuing this trend, 85% of drilling activity is now directed toward natural gas production.
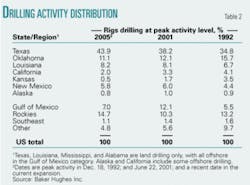
Table 2 details the share of each region’s oil and gas activity since 1992 as measured by the Baker Hughes Inc. rig count. It shows drilling activity shifting out of states such as Alaska and California that are dominated by oil production. Texas and New Mexico show definite long-term movements of drilling activity into the region, both during 1992-2001 and in the current expansion. The Rocky Mountain states fell out of favor with explorers in the 1990s but have returned strongly in the present cycle.
Oklahoma and Kansas have seen continuing exploration declines since 1992. The Gulf of Mexico clearly has not done well in the current cycle. It was the big winner in the 1990s, when its share of drilling activity grew to 12.1% from 5.5%, but it has fallen back to 7% in recent months. The number of rigs working in the gulf is now below its level in April 1999, during the last trough in overall drilling activity.
State data on marketed natural gas production is available only for 1997-2003.4 In states such as Texas and New Mexico, however, significant increases in drilling have managed only to maintain stable production. In Kansas, Oklahoma, Louisiana, and the federal offshore areas, stable or declining drilling activity has resulted in rapidly dropping production levels. Production is down 10-15% since 1997 in Louisiana, Oklahoma, and the gulf and 39% in Kansas. Production in the Rockies is up 72%. Nationwide production is down 1.4% over the period.
Employment trends
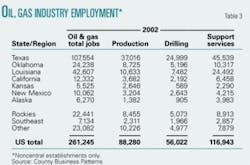
Table 3 shows one measure of the distribution by state and region of oil and gas employment. The data here were taken from the Census Bureau’s County Business Patterns report, whereas data in Fig. 1 came from the Bureau of Labor Statistics’ monthly Current Employment Statistics Report. In Census Bureau data, workers are classified as working in either central or noncentral establishments.
Central establishments serve multiple establishments, such as headquarters, laboratories, or central warehouses. Table 3, which counts employment only in noncentral establishments, mostly captures employment serving specific regions or localities and at field establishments. Because the Census Bureau no longer reports the specific industry serviced by a subset of central establishments, upstream employment in cities with high concentrations of central establishments is probably underrepresented.5
Texas dominates in oil and gas employment, accounting for 107,554 jobs, or 41.2% of the total. Louisiana and Oklahoma follow with a combined 25.6% of jobs. The combined oil-producing states and regions account for 91.2% of employment. Not surprisingly, drilling and oil services make up 66.2% of the industry’s jobs found in the field. Texas, Oklahoma, and Louisiana also lead in the number of drilling and service workers.
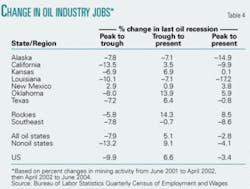
Table 4 returns to data comparable with that used in Fig.1. It shows percentage changes in oil-related employment by region over the current drilling cycle.6 These state and regional data are available only through June 2004. For the US as a whole, employment fell 9.9% during June 2001 to April 2002 then rose 6.6% by June 2004. The net loss in industry jobs by June 2004 was 3.4%.
The regions that did better than the US average in retaining jobs were those with growing levels of drilling activity-Texas, New Mexico, and especially the Rockies. Oklahoma does well, but probably more because of gains in producer headquarters employment than in drilling or support, especially in Oklahoma City. States having job losses are also predictable on the basis of activity shifting out of Alaska, California, and Kansas. Louisiana has also lost jobs as the share of drilling activity shifts out of the Gulf of Mexico.
Shifts by metro area
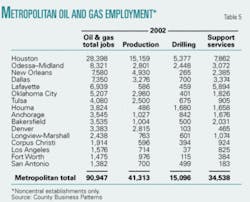
Table 5 shows the sectoral composition of oil and gas-related employment for 16 metropolitan areas, with the jobs divided into oil and gas extraction, drilling, and support. The employment measure here includes jobs in noncentral establishments only, excluding headquarters, laboratories, and central warehouses. The exclusion of central establishments affects Houston, Odessa-Midland, New Orleans, Dallas, and Lafayette the most, because these cities lead the way in totals for such establishments.
The typical metro area has 45.4% of its oil and gas-related jobs in producer establishments. The metro areas whose upstream employment is dominated by producers are Denver 83.2%, Fort Worth 66.2%, New Orleans 65%, and Oklahoma City 57.2%. The typical city has 54.6% of its oil and gas-related jobs in drilling and support, but Lafayette has 91.6%, Houma 87.3%, Bakersfield 71.2%, and Anchorage 71%.
The omission of central establishments from this employment measure challenges researchers’ ability to capture the full impact of upstream energy employment in some regions. Official data no longer allow us to separate central establishments by industry, but past studies show that the cities with the largest number of these establishments are Houston, Denver, Dallas, Fort Worth, Tulsa, New Orleans, and Odessa-Midland. 7
The number of central establishments is probably dominated by headquarters in most of these cities, especially Houston. In 1997, for example, Houston had six employees in central establishments for every one in Dallas, the No. 2 city. Dallas and the other cities listed each had 2,500-4,000 oil and gas employees in central establishments, compared with 23,700 in Houston.
Some back-of-the-envelope calculations comparing the data in Table 5 with more comprehensive employment measures suggest that the list of headquarters/central establishment cities has not changed much since 1997.8 Oklahoma City may have moved into the top group, while Tulsa and New Orleans probably have moved down. Houston likely has maintained or added to its lead over the other cities as a headquarters location.
Gains and losses
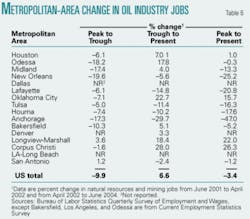
Table 6 shows gains and losses in metropolitan employment in oil and gas over the current drilling cycle. Compared with a 3.4% national loss through June 2004, cities that did notably better include Corpus Christi, Longview-Marshall, Oklahoma City, and Houston. Among those faring worse were Anchorage, New Orleans, Lafayette, Houma, Tulsa, and Midland.
These results partly reflect the shifts in drilling activity already noted. Improvement in Corpus Christi and Longview-Marshall reflect a substantial pickup in drilling activity throughout Texas. The pullback in Gulf of Mexico drilling hurts Houma and Lafayette. However, because Table 6 combines central and noncentral establishments, shifts in headquarters activity also play a role.
Given that many drilling and oil support activities tend to follow drilling activity from one place to another, central establishments-especially headquarters-are relatively “sticky.” Companies find it attractive to locate near many similar businesses in order to lower their cost of doing business. This is because of the industry-specific knowledge generated by headquarters cities and shared through daily interactions such as conferences, professional meetings, and even cocktail gossip.
Such cities also offer a large contingent of specialized support services, skills, and labor. Industry suppliers are drawn there to be near many large customers. These characteristics-called “economies of localization”-make it easier and cheaper to operate in large urban clusters of oil and gas-related activity than elsewhere.
Houston has dominated headquarters activity in recent years, with many of its gains often coming on the downside of drilling cycles as companies seek lower costs to survive. According to the list of the largest 100 oil producers in 2003, only six cities today are home to the headquarters of more than two of these producers: Houston has 28, Denver 11, Dallas 9, Oklahoma City 6, Tulsa 5, and Fort Worth 4 (OGJ Sept. 13, 2004, p. 36). Dallas has the most producer assets with $182.1 billion, although 95.7% of them belong to one company, ExxonMobil Corp. Houston, with $170.6 billion, and Oklahoma City, with $42 billion, follow (OGJ, Sept. 13, 2004, p. 36).
Specific mergers can quickly move large numbers of headquarters jobs from one city to another. There is almost certainly a strong element of shifting headquarters activity in the recent success of Oklahoma City, where local companies such as Devon Energy Corp., Chesapeake Energy Corp., and Kerr-McGee Corp. have been active in mergers. The same may be said of the losses from Tulsa to Houston as a result of Phillips Petroleum Corp.’s merger with Conoco and Citgo Petroleum Corp.’s move to Houston. Midland, a producer-headquarters city, fails to keep up with national employment trends, while Odessa, a service center, stays ahead of the US employment pace as drilling expands. ✦
References
1. The Rocky Mountain states include Colorado, Montana, Utah, and Wyoming. Midcontinent states include Arkansas, Iowa, Kansas, Minnesota, Missouri, Nebraska, and Oklahoma, but the bulk of production originates in Kansas and Oklahoma.
2. The Bureau of Labor Statistics since 1990 has reported monthly the nationwide data on oil and gas extraction and oil and gas support. Data on drilling are reported, only with a lag, in the “Quarterly Wage and Employment Survey.” As a result, we projected drilling employment as a function of the rig count for the final 6 months of 2004.
3. Rauch, R., “The New Old Economy: Oil, Computers, and the Reinvention of the Earth,” The Atlantic Monthly, January 2001, p. 42.
4. In 1997, the Department of Energy created a separate category for federal offshore. Before that, offshore data were included in data for individual states. Data for 2004 are only available through October by state.
5. The data in Table 3 from County Business Patterns remain the latest available, and because of changes in industry definitions comparisons cannot be made to dates before 2001. The 2001 release also marked the end of central establishments being reported for individual sectors so only noncentral establishments are reported.
6. In Table 4, disclosure limitations mean that total mining can only be reported by state, not by oil and gas specifically. For the large oil states in the table, oil and gas dominate the mining sector, and the reported percentage changes are a reasonable estimate of swings in oil-related activity.
7. Gilmer, R.W., and Ishii, J., “The Oil Industry and the Cities: Consolidation in the Oil Extraction Industry,” Houston Business, Federal Reserve Bank of Dallas, April 1996; and Gilmer R.W., and Kang, D.G., “Urban Oil Consolidation: An Update,” Houston Business, Federal Reserve Bank of Dallas, August 2002.
8. The calculation referred to is a comparison of a comprehensive measure of employment in oil and gas extraction prepared by the Bureau of Economic Analysis to the number in Table 5. The difference between the measures includes a broader definition of establishment employment and the self employed. However, half or more of the difference can be attributed to jobs in central establishments. The differences were largest in those cities where central establishments have been found to be important in past studies.
The authors
Robert W. Gilmer is vice-president and senior economist of the Federal Reserve Bank of Dallas, currently serving as officer in charge of the El Paso branch. He also oversees regional economic research in the Houston, San Antonio, and El Paso branches. He edits two of the bank’s regional publications and has written for numerous academic, professional, and business publications. Prior to joining the bank in 1989, Gilmer served for 7 years on the staff of the chief economist at the Tennessee Valley Authority. He worked as research economist at the Institute for Energy Analysis in Oak Ridge, Tenn., during1976-82 and the Institute for Defense Analysis in Arlington, Va. in 1973-76. Gilmer holds a BA in economics from the University of Texas at El Paso and earned an MA and PhD in economics from the University of Texas at Austin.
Jonathan L. Story is a research analyst at the Houston branch of the Federal Reserve Bank of Dallas. Story joined the bank staff in 1998. He has a BA in economics from the University of Texas at Austin and an international studies degree from the Political Institute of Paris.
