Second derivative yields new insights to well test analyses
Well test analyses that include the first and second derivative of pressure plotted on a semilog scale can help detect radial flow.
Plots of pressure data from short transient tests often fail to detect the radial-flow regime, but one can deduce this flow regime from the zero-slope line with a certain intercept on the first-derivative curve and a zero-slope line with zero intercept on the second-derivative curve.
A transient-pressure test in one of Iran’s gas reservoirs illustrates the application of these analyses.
Pressure-transient tests
Pressure-transient tests for characterizing a reservoir involve the analysis of fluid flow through the reservoir and into the well.1 Both single and multiwell tests help in this characterization.
These tests describe the reservoir under dynamic conditions, as compared with geologic log data obtained under static conditions.
In the tests, near-wellbore conditions first affect the pressure-transient response. The next pressure response is affected by the flow behavior associated with reservoir properties up to where the transient encounters the boundary effects in late time. After reaching the boundary, the flow regime changes to a pseudosteady or steady state.
Wellbore storage and skin effect control the early portion of the well test data. Often one needs an extended test to overcome these effects and obtain the desired straight line on a standard semilog plot. Interference from other wells and in reservoirs with complex features such as dual porosity, sealing faults, layered reservoirs, etc., however, can distort or mask this straight-line behavior.
In such cases, interpretation of well test data becomes uncertain and unreliable.
Radial-diffusivity equation
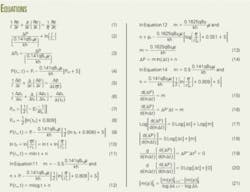
The linearized diffusivity equation (Equation 1, see equation box) governs the pressure distribution within the reservoir and its dependence on time for a single flow.2
In the equation η is the diffusivity constant and is defined as η = k/ϕμct. The relationship assumes that permeability (k), porosity (ϕ), fluid viscosity (μ), and total compressibility (ct) are independent of pressure.
This equation plays a major role in well-test analysis and forms the basis of the study of inflow and pressure-transient analysis in this article. Equation 1, subject to appropriate initial and boundary conditions, also forms the basis of classical buildup and drawdown testing.
The most commonly used external boundary conditions include no flow, constant-pressure, and infinite-acting boundaries, while the most commonly used internal boundaries (wells) include constant rate, constant pressure, and multirate specifications.
Analytical solution
Pressure-transient analyses employ mathematical models to relate pressure response due to changes in flow rate. Well-test interpretation extensively uses this analytical solution of the flow model to provide a solution for certain suitable problems.
The analyses match the mathematical model’s pressure response with the measured reservoir-pressure response. From these model parameters, one can infer the reservoir parameters.
Well-test analyses often include the concept of dimensionless variables for solving the unsteady-state flow equation. Equation 2, in US field units, defines pressure drop for any reservoir of particular size r that produces at a constant rate q.3
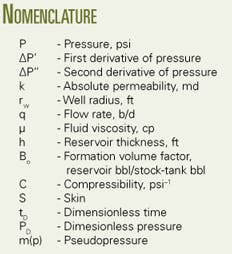
Because the right-hand side of the equation is dimensionless, any pressure drop divided by the term 0.141qBoμ/kh is a dimensionless pressure. In the relationship, Bo is the formation’s volume factor, μ is viscosity of the fluid, k is permeability, and h is reservoir thickness.
One can use the dimensionless form ∆PD = ln(rD) to describe pressure variation. In this relationship rD = r/rw.
If one assumes that constant-rate production is initiated at an initial pressure Pi throughout the reservoir, the flowing bottomhole pressure (Pw, t) is governed by the constant-rate solution to the radial diffusivity equation (Equation 4).
One can use the PtD pressure function because the pressure is at the well. The term S is the skin effect, a dimensionless pressure drop caused by near-wellbore damage or improvement.
The important point in Equation 4 is that it mathematically estimates the PtD and calculates the pressure at the well at a constant production rate.
Hurst and others have provided general solutions that apply to any reservoir.4 In fact, the solutions treat the product of ηt as one variable.
Equation 6 is a new version of the diffusivity equation in terms of dimensionless terms that is derived by replacing r and ΔP in Equation 3 with a dimensionless rD and ∆PD and then rearranging the terms. In the equation tDw = ηt/rw2.
Equation 6 shows that PD is a solution of Equation 5 for specific boundary conditions and reservoir geometry. PD is a function of tD and rD, and practically speaking, dimensionless pressure is a number obtained from an equation, a table, or a graph.
The radial diffusivity equation, including PtD, Ei function, and natural log are some of the correlations of dimensionless pressure for certain well systems with different limitations.5 One can estimate the Ei function from graphs and it is given by Equation 7. The other pressure solutions, however, can be approximated by the same log equation when the reservoir is infinite acting and the dimensionless time (td) is greater than 100.
The log solution is the simplest because it requires no graphs and one can mathematically manipulate the expression to obtain other expressions.
For instance, the substitution of Equation 8 into Equation 4 results in Equation 9, and one can expand td to obtain Equation 10.
Grouping all expressions into a constant yields Equation 11.
Equation 11 shows that a plot of Pw,t vs. ln(t) gives a straight line with slope of m. Most log paper, however, is to the base 10 rather than to the base e, and therefore it is advisable to substitute 2.303 log t for ln t in Equation 11. Rearrangement of the terms leads to Equation 12.
Equation 12 shows that a semilog plot, also known as a Miller-Dyes-Hutchinson (MDH) plot, of well pressure (Pw) vs. log t will exhibit a straight line during transient flow behavior.
Equation 13 defines the slope m of the straight line. From this slope, one can calculate the undamage permeability k because the skin factor S includes the additional pressure drop caused by damage around the wellbore.
Well-test analysis
A well test obtains the change in pressure (ΔP) vs. elapsed time (Δt) since the start of the transient. Traditional analysis plots ΔP against the log of (tp + Δt)/Δt, a dimensionless variable in which tp is the duration of the flow period. Radial flow appears as a straight line trend on the Horner plot.
Crucial to the quantitative interpretation is the diagnosis of the radial flow because it provides values for k and S.
Although the Horner plot is acceptable for interpreting the radial flow of an easy-to-interpret test, a straight line trend is often difficult to pick out. The plot may have several straight-line trends of which only one represents radial flow. Also the late-time data on the plot fail to provide ready insight into the nature of reservoir limits.
The solution discovered in the early 1980s was a double logarithmic, or log-log plot of two data sets vs. time. One set is simply ΔP, while the other is the gradient or derivative of the response on the Horner plot.6 The advantage of the log-log plot is that heterogeneity can be noted for reservoirs with similar characteristics and pressure response but perhaps differing in thickness, porosity, and permeability.
The heterogeneity may correspond to the borehole formation configuration or boundary geometries.
A pressure transient shows several regimes on a log-log plot,7 each seeing deeper into the reservoir. The first regime typically reflects wellbore storage, during which both the pressure and derivative curves overlie and increase along a straight line of unit slope.
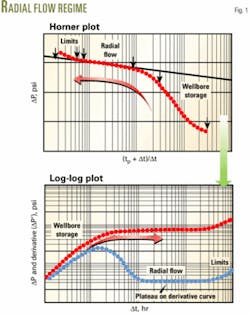
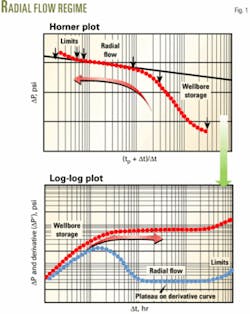
As wellbore fluids stabilize, pressure continues building up but at a slower rate. The derivative curve swings down, eventually flattening out as the transient moves far enough from the wellbore to achieve radial flow. Because the radial-flow regime is a straight-line trend on the Horner plot, the derivative curve on the log-log plot is constant and traces a horizontal line (Fig.1).
The interpreter’s first task always is to identify this derivative plateau, but this may require waiting a long time in transient tests dominated by wellbore storage.
Lengthy wellbore storage can totally mask earlier flow regimes on the derivative response. The effect further deteriorates if well pressure towards the top of the well drops below the bubblepoint pressure and part of the well is filled with compressible gas. Shutting in the well downhole to minimize the fluid volume in the wellbore can reduce the wellbore storage effects.
Some field examples of buildup tests have shown a plateau for the radial flow that is not readily visible on a derivative curve. In this case, one may imply that the test duration is insufficient to reach radial flow or the radial flow is masked by wellbore storage. This may produce several possible answers.
In these cases, the first derivative plot fails to provide insight into the flow patterns for estimating permeability. Hence, this requires a new approach, providing that the pressure response does show the radial flow.
The second-derivative curve can distinguish and validate the radial flow seen on the first-derivative curve.
Derivative methods
Some publications in the early 1980s showed that the downhole pressure derivative coupled with conventional pressure-vs.-time functions plotted on a log-log scale offers more information than the traditional plot. This is because the pressure derivative is more sensitive to reservoir characteristics than the pressure and therefore responds distinctly to changes.
Bourdet was the first to introduce the combined plot of log pressure change and log derivative of pressure change with respect to superposition time as a function of log elapsed time.8
Many analysts rely on the log-log plot of pressure derivative vs. shut-in time to diagnose which reservoir model can represent a given pressure-transient data set.
In the analysis, the derivative approach considers the time rate of pressure during a test period. To emphasize the radial-flow regime, the analysis uses the derivative with respect to the log of time.8
Rearrangement of the terms in Equation 11 produces Equation 14.
The pressure derivative is in respect to the natural log of time, ln(Δt), and has the same units as pressure. Therefore, one can plot both the pressure change and the pressure derivative on the same graph.9
At the start of the infinite acting radial flow, the derivative becomes constant at a given value of m.
Taking the log of Equation 15 yields Equation 17.
This equation shows that for pressure data related to radial flow, a plot of the pressure derivative vs. elapsed time (Δt) on a log-log scale results in a straight line with a slope of zero and an intercept of log m.
One can also plot the derivative on a semilog graph (Equation 18).
With a value for m and using Equation 13, one can estimate the permeability. Furthermore, whenever a plot of pressure vs. log of time is a straight line, the pressure derivative will be constant.
Similarly, taking the second derivative of pressure in Equation 15 results in Equation 19. The second derivative can also be plotted on a semilog graph (Equation 20).
Equation 19 shows that a plot of the second derivative vs. log (Δt) results in a straight line whose slope is zero with zero intercept. This validates the conclusion that the first-derivative curve shows radial flow.
One can detect radial flow on both pressure and first-derivative curves on log-log scale and first and second-derivative curves on semilog scale.
Note that the second derivative cannot be displayed on a log-log plot because it generates negative values.
As radial flow starts to flatten on the first-derivative curve, the analyzed data also begins to flatten and approach a zero intercept on the second-derivative curve. One can detect radial flow with less uncertainty when combining both plots.
Also in cases where testing time is insufficient to detect radial flow, the prediction of the likely shape of either derivative curves on a semilog plot will assist the engineer in demonstrating the feasibility of detecting and characterizing the anticipated reservoir features.
Figs. 2-5 show typical shapes for the first and second-derivative curves of some well, reservoir, and boundary models.
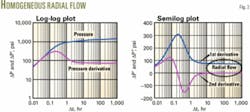
Fig. 2 shows a plot of pressure change and the first derivative on log-log scale and first and second-derivatives on semilog scale for the most common response, which is a homogeneous reservoir model with wellbore storage.
The flat derivative portion is easily seen at about 12 hr.
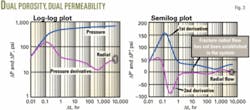
Fig. 3 shows the plots for a dual porosity and dual-permeability reservoir model. The first plateau indicates a fracture-controlled flow on the first-derivative curve, while the second-derivative curve implies that the total radial-flow regime has not been established because the values are not zero. Therefore, one cannot perform a fracture radial-flow analysis.
This is then followed by a valley on the first-derivative curve reflecting a transition-regime effect (flow from the matrix to the fracture). This effect breaks down into a valley and a hump on the second-derivative curve.
The second plateau on either derivative curve represents radial flow for the total system, which consists of fracture and matrix flow. Both plots show total radial flow.
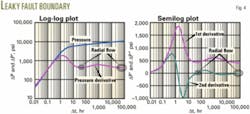
Fig. 4 depicts the plots for a homogeneous reservoir with a leaky fault model. One can identify the radial-flow regime in the reservoir before it reaches the fault on the second-derivative plot. In this case, radial flow on the log-log plot is where the second derivative has zero values from 40-50 hr. Both plots show the total radial flow after the transient experiences the fault effect.
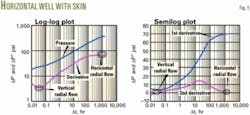
Fig. 5 illustrates the plots for a horizontal well model. The first zero readings are related to vertical radial flow, and the second zero readings are related to horizontal radial flow.
The second-derivative curve clearly shows a short vertical radial flow at about 0.02-0.035 hr. It also indicates that horizontal radial flow has not yet been established in the system because the second derivative curve does not have zero values.
These examples show that use of a second-derivative curve can reduce the uncertainties in interpreting well tests. When the plateau on the first-derivative curve is not flat, the drawing of a tangent line may over or underestimate the permeability.
The selection of a test time related to radial flow is more accurate with the use of the second derivative than with the first derivative. This results in a proper tangent line (zero-slope line) corresponding to the analyzed data because these points have zero values on the second-derivative curve and represent a more realistic radial-flow pattern. Hence, one can optimize the estimated reservoir permeability.
An important advantage of the second derivative is that the radial-flow pattern has a standard appearance (zero values) on semilog plots.
Gas reservoir example
A transient-pressure test in one of Iran’s gas reservoirs illustrates the application of these analyses. The buildup test attempted to ascertain if high skin or low formation permeability caused a gas well to have a low flow rate.
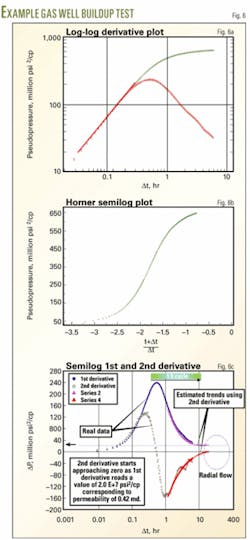
Fig. 6a shows the log-log plot of pressure and pressure derivative for the main buildup period. The curves fail to show a plateau indicating radial flow for the late-time pressure data on the derivative curve, dominated by wellbore storage effects. The curves indicate that a 7-hr test duration in the main buildup period was insufficient to detect radial flow.
Fig. 6b is a Horner plot of the same data that has an apparent straight line in the late-time data, but one cannot draw the best straight line because the derivative curve lacks a plateau. The analysis, therefore, required a second-derivative plot to estimate the start of radial flow.
Fig. 6c shows the first and second derivative data plotted on a semilog scale, as pressure change vs. log Δt. The plot reveals that the test duration was insufficient to reach radial flow because the second-derivative curve does not indicate the zero values for radial flow.
As a rule of thumb, radial flow begins about 1.5 cycles in time after the end of wellbore storage.10 This assumption indicates that radial flow would start after about 20 hr.
Based on the second-derivative trend for radial flow in homogeneous reservoirs (Fig. 2), the analysis fitted the curve of the second-derivative points and the zero value point at 20 hr, at which time the second derivative should be zero. The next analysis step estimated with Equation 21 the first derivative of pressure data ([m(p)]') from the fitted curve of the second-derivative points ([m(p)]'').
In the radial-flow region, the estimated pressure derivative values were 2E+07 psi2/cp, which corresponds to a 0.42-md permeability and a 9.5 skin.
A check of the results used the beginning of the infinite acting radial flow at 12 hr and 30 hr after the start of the buildup test. These calculations led to estimated 0.44 md and 0.31-md permeabilities, respectively.
The results highlighted an excellent convergence of permeability values, compared with the 0.42 md obtained by considering the beginning of infinite-acting radial flow at 20 hr, which is 1.5 cycles after the end of wellbore storage.
The results indicate that the low well productivity is not due to a high skin but to low reservoir permeability.
Acid stimulation of the well failed to increase significantly the flow rate. Also petrophysical evaluations showed that the reservoir had an average 0.3 porosity and that fractures did not contribute to production.
Acknowledgment
The authors appreciate Mohamed Tchambaz, Schlumberger DCS-Iran; Seyyed Reza Shadizadeh, Petroleum University of Technology, Iran; Thormod Ekeyy Johansen, Memorial University of Newfoundland; and Nabeel Al-Adani, Schlumberger DCS-Canada for many helpful discussions regarding this article.✦
References
1. Earlougher, R.C. Jr., Advances in Well Test Analysis, Monograph Series, SPE, Richardson, Tex., 1977.
2. Ahmed, T., Reservoir Engineering Handbook, Second Edition, Houston: Gulf Professional Publishing, 2001.
3. Muskat, M., The Flow of Homogeneous Fluids through Porous Media, New York: McGraw-Hill Book Co. Inc., 1937.
4. Hurst, W., and Van Everdingen, A.F., “The Application of the Laplace Transformationt of Flow Problems in Reservoirs,” Vol. 186, AIME Transactions, 1949, p. 304.
5. Slide, H.C., Worldwide Practical Petroleum Reservoir Engineering Methods, Tulsa: Pennwell Publishing Co., 1983.
6. Bourdet, D., Ayoub, A.J., and Pirard, Y.M., “Use of Pressure Derivative in Well-Test Interpretation, Paper No. SPE 12777, SPE Formation Evaluation, Vol. 4, No. 2, June 1989, pp. 293-302.
7. Bourdarot, G., Well Testing, Interpretation Methods, Technip, Paris, 1998.
8. Bourdet, D., et al, “A New Type of Curves Simplifies Well Test Analysis,” World Oil, May 1983, pp. 95-106.
9. Ehlig-Economides, C., “Use of the Pressure Derivative for Diagnosing Pressure-Transient Behavior,” Paper No. SPE 18594, JPT, October 1988, pp. 1,280-82.
10. Economides, M.J., Reservoir Stimulation, Second edition, Schlumberger Educational Services, Houston, 1989.
The authors
Hassan Bahrami (hbahrami@ tehran.oilfield.slb.com) is a reservoir log analyst for Schlumberger DCS in Iran. Prior to Schlumberger, he worked for Tehran Energy Consultant as a reservoir engineer. Bahrami holds a BS in chemical engineering from Persian Gulf University and an MS in reservoir engineering from Sharif University of Technology, Tehran.
Jamal Siavoshi (Siavoshi@ engr.mun.ca) is a PhD candidate at Memorial University of Newfoundland. He previously worked for the Iranian Offshore Oil Co., Tehran Energy Consultant, and Pars Oil and Gas Co. Siavoshi holds a BS in petroleum engineering from Petroleum University of Technology, Iran, and an MS in reservoir geoscience and engineering from the Institut Français du Pétrole (IFP), France. He is a member of SPE.
