Advanced application enhances operation for US Gulf Coast gas pipeline
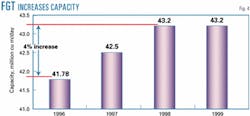
Florida Gas Transmission Co., joint venture of Enron Corp. and El Paso Corp., both of Houston, has employed advanced applications for pipeline modeling and simulation to increase sustainable deliveries by 4% without additional compression or line pipe.
The tools have also permitted the company to reduce operational costs.
This article presents typical functionalities of these advanced applications and how they have supported the daily operation of a pipeline transportation company such as FGT.
Combining data
Current global gas markets require transportation companies to improve their procedures with real-time data to support daily decisions. Efficiency and profitability pressure pipeline operators to go beyond typically conservative operation. It is no longer possible for operations-gas control simply to keep the pipeline operating acceptably and be marginally profitable.
Nor is it possible for business decision-makers vaguely to understand the value of the transport capacity that they may have for sale or the ability to move another 1 Mcf of gas through constraint points.
Real-time modeling applications provide operators with accurate information to support decision making. Detailed pictures of the current available capacity at any point in the network as well as possible impact of moving additional gas through the pipeline can be evaluated in advance with these application tools.
Success today requires that pipeline operations and business data be combined and synchronized to produce the greatest profit opportunity. Advanced applications need to be designed and implemented with the goal of interaction between the business and operational worlds.
Reaching this goal requires following some basic concepts:
- Integration. Most natural gas pipeline companies have many legacy systems that cannot be replaced entirely in a short time. The framework for any forward-looking system design, therefore, must seamlessly blend the legacy system with newer systems from multiple suppliers.
It is not only an integration with legacy systems but also the integration with systems from different sources, SCADA (supervisory control and data acquisition) and real-time modeling, electronic flow measurement, with nomination packages, SAP, marketing tools, etc. The information must flow from one application to the other coherently, sharing relevant data between these two worlds.
- Optimization. Once both worlds have been integrated, the operational process must be optimized. With the company's goal now clear, it is now time to define the best way to get there. Optimization tools for compressor units and line pack have an important role in the daily operation of the pipeline.
Once a communication-channel is established between the operational and business worlds, the system and all its advanced applications will become an administration tool for optimizing profits.
Traditionally, simulation tools have focused exclusively on the gas control operator or the planning group. Now, these tools focus on the entire corporation by making both business and operational data available. The corporation's procedures defining the transportation business could change, depending on the market in which it is operating.
Nevertheless, transportation in an open market follows determined outlines that facilitate and regulate the interaction between the transportation company and the shipper.
Model implementation
This section primarily discusses the definition, implementation, and application of modeling technology for Florida Gas Transmission and the resulting achievements. The overall achievements and change were achieved gradually.
Real-time modeling
The objective of real-time modeling applications is to help operators improve pipeline performance. The most useful applications for gas transportation systems are related to predictive capabilities, such as off-line models, "look-ahead" models, and "on-line" predictive models.
Other applications for optimization purpose are frequently needed in these networks.
The purpose of an on-line system is to provide information when the SCADA systems cannot because of a lack of instrumented points to record and also to allow the operator to see the pipeline's future and provide an accurate picture of the pipeline.
The pipeline modeling system and its advanced applications are tools to aid the operator in interpreting the past, evaluating the present, and considering alternatives for moving product and operating the pipeline in the future based on feasibility, desirability, and cost.
The general concept of the model may be defined as a set of related procedures, which together define a process. In this case, the process is the physical pipeline behavior. To represent this physical behavior, Energy Solutions International Inc., Houston, has developed a mathematical model for steady state and transient conditions, based on such groups of factors as the governing equations (conservation of mass, conservation of momentum, energy equation, and equations of state), boundary conditions, and operation pipeline information. The dynamic model can simulate any transient pipeline conditions.
One of the most important factors for evaluating the performance of a modeling system is its "robustness," which refers to the system stability. The model's equations mentioned previously (conservation of mass and momentum) are solved numerically in a fixed x-grid along the pipelines in order to ensure high stability and excellent performance.
The solution considers such variations as friction factor, thermal expandability, and compressibility of fluid and pipeline. This method improves the performance of the model, avoiding possible unstable situations.
With this method, the model is solved for each element of the pipeline network. Thus, if there is some unstable solution for one element in the network, this solution will not affect the overall model solution.
In order for a model to simulate the real world in a proper software application, it must contain a greater amount of detail than traditionally incorporated into engineering models: Essentially all functional operational details of the physical network and equipment must be modeled.
The main purpose of this model is to provide a set of pressure-flow, composition (product property), and temperature profiles along the pipeline, which represent its physical behavior.
Based on this information, the system processes all the calculated and received data finally to implement the advanced applications.
The key to the success of any software system is the use of well-proven, dependable software, which uses the latest available methods and contains the enhancements necessary to operate in the real world.
Predictive, 'look-ahead' modeling
Based on the real-time model, the predictive model tool is a simulation facility capable of performing "what if?" scenarios. The predicative model provides the capability to simulate pipeline operational strategies without disturbing normal pipeline operations.
The model utilizes any combination of measured, calculated, or artificial process measurements or equipment statuses. It is executed in time steps and provides a simulation of pipeline conditions.
Based on the current status of the network, the "look-ahead" tool provides forecasting of near-future pipeline conditions. The look-ahead tool performs a faster-than-real-time forced flow analysis to discover the consequences of controlled adjustments, independent of but based on real-time pipeline operations.
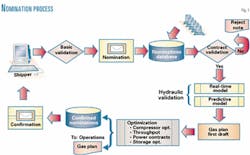
In addition, this application uses the information related to nominations gathered from shippers to evaluate if some pressure constraint will be violated by current consumption and remaining capacity requested by the shipper.
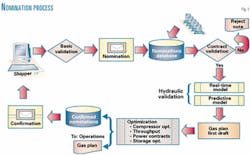
Fig. 1 shows a typical nomination process.
Building, implementing pipeline model
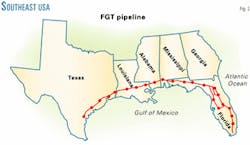
With approximately 5,000 miles of pipe and 300,000 hp on the system, the Florida Gas Transmission pipeline has delivery capacity of about 1,650 MMcfd of natural gas. The system shows dynamic swings in line pack caused by delivering the majority of its gas to electric generation power plants.
Unlike other North American pipelines, the system's peak deliveries occur during summers to meet cooling loads (Fig. 2).
The modeling project began shortly after FGT increased its delivery capacity from 925 MMcfd to 1,460 MMcfd. Overall system complexity increased with the addition of a parallel third line operating at higher pressure and with turbine compressors instead of traditional reciprocating compressors.
Furthermore, although FGT's pipeline has no market area storage, it still faces a high load-factor market with a large percentage of the market customers using gas to meet electric generation peaking loads.
Due to the increase in delivery capacity and the difficult market demands, FGT decided to build a real-time transient model to give those who operate the pipeline daily a tool to assist in meeting the challenges of operating a fairly difficult pipeline.
Engineering or off-line simulation models have been successfully used for many years. But in the past, real-time or online dynamic models have proven difficult to implement successfully. FGT found success in its real-time model by first having the gas control department build and use the model to manage everyday problems and outages encountered on the pipeline before attempting to use the model to optimize the system.
Following is an approximate timeline of the implementation of Energy Solutions' model, the related events, and the related improvements:
- March 1995. Expansion of pipeline capacity to 1,460 MMcfd completed. The decision was made to proceed with the selection of a real-time model vendor.
- March 1996. FGT decides to model the market and receipt portion of the pipeline and all operational modes of each compressor stations.
- September 1996. Modeling project completed.
- December 1996. Model is used to help with outage coordination effort of several major pipeline jobs.
- January 1997. Model proves to be helpful in determining how to configure portions of pipeline in preparation for smart pig runs.
- February 1997. Model is used to determine more fuel-efficient operational modes for winter operations.
- May 1997. Model used to analyze how to optimize horsepower configurations to improve overall throughput.
- July 1997. As a result of model studies, the operational modes of several compressor stations are changed. Market deliveries are increased 2% above previous levels.
- September 1997. Increased effort using model to determine how overall fuel usage could be reduced.
- April 1998. Increased effort using model to determine how to further increase total throughput and reliability.
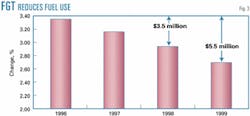
- June 1998. With the combination of compressor station and line-pack management optimization, throughput is increased another 2% while total system reliability increases. Fig. 3 shows the significant fuel-use reduction achieved.
- October 1998. Development begins on the model to create a gas-control trainer.
- January 1999. Yearly total fuel use charge to market area customers for 1998 shows a 12% reduction compared to previous years.
- February 1999. Gas control trainer is completed.
- July 1999. More peak-day record deliveries are achieved with continued stable and reliable service provided system wide. Fig. 4 shows system capacity increases over 4 years.
- January 2000. FGT real-time model is enhanced by including Phase IV facilities. Optimization flow studies begin to compare current load patterns with capabilities of upcoming facilities.
- January 2001. FGT real-time model is enhanced by including Phase V facilities. Optimization flow studies begin to compare current load patterns with capabilities of upcoming facilities.
- April 2001. Phase IV pipeline expansion completed.
- August 2001. Optimization efforts contribute to incremental record deliveries. Fuel-use levels are kept below design conditions.
Daily use
FGT uses Energy Solutions' model virtually everyday as part of the effort to manage the FGT system.
The model's use ranges from the relatively simple gathering of data to meet a request to determining how to optimize a portion of the overall system while facing a unique operational situation.
Following is an approximation of what percent of time the real-time model is used in gas control for each of these different functions: outage coordination-reliability studies, 50%; SCADA error detection and problem resolution, 15%; configuration analysis to best facilitate pigging 5%; improved overall system performance studies, 10%; operational data gathering for third parties, 10%; and gas control training, 10%.
Outage coordination
The model is used the greatest percentage of time to determine how most efficiently to operate the pipeline during horsepower or pipeline segment outages. Flow studies are primarily run to test different operational configurations to determine the positives and negatives of each configuration.
After the best operational configuration has been selected, the model determines how much throughput is affected so that the pipeline can be scheduled appropriately. Frequently in the past, an overly cautious restriction was placed on the market because of the lack of ability to study the impact of an outage.
SCADA error; problem resolution
Day-to-day, the model often indicates that the SCADA system is reporting information that contradicts reality. The FGT SCADA system monitors and receives information from more than 24,000 individual points; the model can provide assistance primarily with pressure, flow, and condition-of-state SCADA points.
The model cannot know which SCADA point is sending false information, but it can determine that a set of SCADA point readings cannot exist at the same time.
The model has indicators along the pipeline that will let the user know when some error is discovered.
The model will also indicate that a physical condition in the pipe is not as is reported. This is particularly helpful with regulators and valves that do not have SCADA measurement. The model has often shown that a problem exists. After an investigation of whether the SCADA measurement was working, the physical states of valves and regulators were checked.
The model has been particularly helpful in determining when regulators have drifted significantly from their intended set point.
Flow studies for pigging
Smart pigging allows for the gathering of critical pipeline data and is a routine part of the operation of the FGT system. Smart pigs must move down the pipeline at speeds ranging 4-6 m/hr.
If the pig's speed deviates significantly, the data gathered become unreliable and another smart pig run is necessary along with the additional cost of each smart pig run.
The model is used to determine the horsepower configuration for all the stations in the region surrounding the pigging operation. Once a configuration is chosen that will provide the most stable flow conditions for the smart pig, receipts and deliveries are scheduled according to planned configuration.
Building credibility
During 1996 and 1997 as the model was successfully used to coordinate outages better, an overall confidence in the model was established. This confidence was critical in the graduation of the model to an "optimizer."
After this credibility was established, the model began to be used as a tool to study how to optimize individual compressor stations and the entire system from overall throughput, fuel use, and reliability standpoints.
If users of the model had attempted to try first to undertake the challenge of optimizing total throughput and total fuel use, there would have been no track record to build on. Without a successful performance history for a tool, there will probably not be enough organizational support to implement change.
Compressor-station optimization
The majority of the functionality at each compressor station is modeled in FGT's model. This allows the user of the model to test almost every operational mode at each of the compressor stations.
Several of our compressor stations have the ability to be operated in many different modes including a few stations that can operate in almost 100 different operational modes. The ability to test these stations in modes that have never been used before has proven invaluable, considering that it is not reasonable to do an actual physical test at compressor stations that are vital in maintaining delivery pressures to large customer sites.
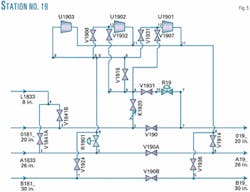
FGT's Station 19 exemplifies one of the stations that was optimized after the model was used to analyze operations. Fig. 5 shows a diagram of this fairly complex station, which can isolate compressor units to individual lines.
In total, the station can have more than 50 operational modes. It was previously operated with one unit isolated to one of the individual lines.
Seven of FGT's largest customers' electric generation stations are downstream of Station 19.
Flow studies determine how to maximize flow and discharge pressure at Station 19 to increase deliveries to these customer sites.
Testing the station's modes of operation led to two important conclusions:
- A more optimal mode of operation should be implemented.
- A regulator needed to be added to enable a specific pressure to be maintained on the 26-in. suction line.
Improving the operations of critical compressor stations and realizing the physical performance improvements were significant steps toward justifying the cost and effort put into building the model.
Delivery increases
In addition to studies conducted at individual compressor stations, the model was used to study how best to configure all market-area horsepower, valving, and regulation.
While the flow studies for Station 19 showed how to increase deliveries downstream of station, the larger perspective market-flow studies showed that more gas could be flowed into the entire market place if a grouping of compressor stations were jointly configured in an optimal throughput position for a larger percentage of the day. (At night, one of these stations needed to be operated for a different set of parameters.)
Furthermore, flow studies indicated that only a certain quantity of gas should be scheduled into specific regions of our market. This seems somewhat obvious that only certain quantities should be scheduled downstream of compressor stations. When gas can flow in either direction in large "loop" sections of a pipeline, however, scheduled delivery targets become much more critical.
FGT was able to increase sustainable deliveries by 2% within 1 year of completion of the model. In addition to delivering more gas into the entire market as a result of optimization, FGT also encountered fewer delivery-pressure problems at customer sites, which in the past had experienced pressure problems that resulted from committing to more gas than was possible to customer regions.
Line-pack management
In fall 1997, many flow studies were done to determine how to minimize fuel use. Flow studies were concentrated on how compressor station optimization and line-pack management affect fuel-use performance. It was determined that optimizing horsepower configurations and maintaining specific line-pack levels in different regions of the pipeline would allow throughput to be maximized and fuel minimized.
Also flow studies indicated that optimal line-pack conditions significantly varied as total market demand varied and that optimal horsepower configurations varied as line pack varied. Recommendations were developed to propose how more efficiently to manage line-pack levels. (FGT has no storage.)
Managing total line pack seems as though it should be relatively simple. But total line pack is affected day-to-day by many difficult-to-control factors including market-area overburns, market-area underburns, receipt-area overdeliveries, receipt-area underdeliveries, actual fuel use differing from the fuel-retention rate, gas losses due to pipeline maintenance or repair, and gas losses due to unaccounted-for activity.
Total line pack, however, can be managed by scheduling market-area payback to reduce imbalances, scheduling receipt-area payback to reduce imbalances, buying gas for injection into line pack, selling gas for withdrawal from line pack, limiting market overburns and underburns via financial penalties for noncompliance, and moving gas into or out of line pack as a result of FGT's "Park & Ride" service.
(FGT's "Park & Ride" service allows customers and marketers to pay for the right to inject or "park" gas into line pack without a corresponding delivery that day or withdraw or "ride" gas from line pack without a corresponding receipt of gas that day.)
These line pack activities are managed by a well-coordinated effort involving several departments within FGT.
Record deliveries
FGT was able significantly to increase sustainable deliveries as the result of optimizing the operations of several key compressor stations and by aggressively managing line pack to maintain line pack at optimal operating conditions.
The previously accepted maximum sustainable delivery into the market was 1,475 MMcfd by June 1998; a new sustainable maximum was achieved-1,525 MMcfd. The optimization of compressor stations was the most critical element. The second most critical factor to increasing throughput was managing line pack to maintain optimum levels.
Flow studies and a review of the compressor performance curves show that individual compressors perform several percentage points better as conditions approach optimum suction and discharge pressures.
When line-pack is maintained at optimum levels across the entire pipeline, the entire pipeline performs several percentage points better.
The same optimization methods were again used on the FGT system after the Phase IV expansion facilities were installed. By August 2001, FGT was again able to deliver incremental volumes at greater than originally designed levels.
Reliability improvements
One of the additional benefits to optimizing line pack levels and horsepower configurations is that customers benefit with improved overall reliability in maintaining delivery pressures during times of maximum deliveries.
As the result of optimal horsepower configurations at target line-pack levels, FGT has made using the service provided as easy as possible for the customers. Physical pipeline performance improvements have allowed our customers to experience better pressures which in turn results in FGT allowing more overburn or underburn flexibility.
Fuel-use reduction
FGT was able significantly to reduce its total fuel use as the result of optimi zation. According to the FGT tariff, the customer pays fuel costs; thus, FGT is improving customer service and competitiveness by reducing the cost of the service provided.
From 1996 to 1998, the fuel rate charged to the customer fell 12% (Fig. 3). This resulted in an estimated savings of $3.5 million to FGT customers for 1998.
The operational mode of some compressor stations was changed in 1997, and some forms of aggressive line-pack management were also started. The line-pack management process was fully implemented in 1998 along with additional compressor station optimization.
For 1999, the average fuel rate was reduced to 2.77%, which resulted in a total estimated saving of $5 million/year compared to previous years.
As new Phase IV expansion facilities have been installed on the FGT system, the same optimization methods again have been used to ensure that its fuel rate stays low so that the cost of service remains as competitive as possible for customers.
The authors
René L. Varón ([email protected]) is vice-president for sales for Latin America for Energy Solutions International, Houston, a position he assumed in 1996. In 1994-96, he was account and project manager for E.Bustamante & Cia., Santafé de Bogotá, Colombia, and in 1993-94, a research engineer for Pontificia Universidad Javeriana, Bogotá. In 1993-96, he was a consultant engineer for Telecomunicaciones Juan Calderon, Bogotá, after working in 1992 as an electronic engineer for Ecopetrol in Barrancabermeja, Colombia. He holds a BS (1993) in electronic engineering from Ponticifia Universidad Javeriana, Bogotá, and a post-graduate degree (1996) in business administration with emphasis in finance from the Escuela de Administracion de Negocios, Bogotá.
Mike Bryant ([email protected]) is manager for gas control, scheduling, and optimization for Enron Corp.'s Florida Gas Transmission, Houston. He has also worked as a mechanical engineering consultant. He holds a BSc in mechanical Engineering from Texas A&M University, College Station.
