Rigorous process models improve profits in Louisiana refinery
An operations planning and economics improvement project at ConocoPhillips's Lake Charles, La., refinery successfully developed and implemented high-quality kinetic process models used for unit optimization, process monitoring, and development of data needed for the refinery linear programming (LP) model.
KBC Advanced Technologies Inc./Profimatics kinetic process models were developed and validated for various process units at the Lake Charles refinery.
Although the primary goal was an improvement in the refinery's LP, the models also provided benefits through unit optimization and monitoring. The project focused on obtaining the best possible model by soliciting input from many different groups within ConocoPhillips and KBC.
Project benefits resulted from the optimization opportunities identified early in the project, and improvements in the refinery LP. The project will have short-term and long-term benefits for the refinery. Implementing only one or two of the key opportunities was enough to justify the project's expense.
This article presents examples of the implemented benefits derived from improvements in the LP, from periodic application of the unit monitoring tools, and from the unit optimization tool.
Key project success factors included a focus on obtaining the best possible model representation for each unit, project coordination by dedicated ConocoPhillips corporate staff, and early agreement on a plan and schedule for maintaining the tools and work processes developed during the project.
Background
ConocoPhillips owns and operates 12 US refineries, with a total crude processing capacity of more than 2.2 million b/d. One of the largest and most complex of these facilities is the 250,000-b/d Lake Charles refinery.
In addition to three crude and two vacuum columns, the refinery has multiple conversion units, including a delayed coker, two catalytic reformers, three distillate hydrotreaters, a fluid catalytic cracker, and a vacuum gas oil hydrotreater.
Because the refinery is on the US Gulf Coast, it has many choices for crude oil supply and can supply a wide variety of product markets. In addition, there are many different processing options for intermediate streams, using the wide variety of units available at the refinery. It is therefore important for the refinery to be able to determine the optimum crude, product, and processing scheme for the current price environment.
In early 2002, the refinery's planning and optimization group determined that the current LP was inadequate for their needs. The existing LP used fixed, true-boiling-point cuts for each crude, which carried through to downstream processing units.
The LP submodels for the conversion units consisted of fixed yields and properties for each crude cut. This structure made it difficult to validate model yields for various units using plant data.
The LP was complex, and it was becoming more difficult to maintain the existing system and train new engineers on its proper use.
The Lake Charles staff, therefore, decided to replace the existing LP and initiated the operations planning and economics improvement project. The new LP model had to:
- Reproduce accurately actual crude and vacuum tower performance, especially for properties needed to predict downstream conversion unit yields.
- Be based on fundamental, kinetic models for the conversion units that can also predict as-produced product yields and properties.
- Have a simple structure and adequate documentation, so that the engineers could maintain and easily understand it.
- Update easily the data tables for new crudes or changes in fractionation configuration and performance, as well as provide updates for conversion unit yield and property corrections.
The refinery's planning staff felt they could develop the LP structure needed for the new model; however, they needed additional expertise for accurate process simulation models to generate the LP data and tools to update these models for changes in plant operations.
Project objectives
ConocoPhillips contracted KBC to provide:
- A Petrofine simulation model for the crude and vacuum unit complex that could generate crude data tables for the LP and complete case studies for new crude blends or operating conditions.
- KBC Profimatics models for conversion units including the FCC, delayed coker, catalytic reformers, alkylation unit, and the naphtha, diesel, and vacuum gas oil hydrotreaters.
- Unit monitoring tools (UMTs) that would help refinery engineers reconcile plant yield data and compare it to model predictions, and calculate key performance indicators (KPIs) for each unit.
- Hands-on training from KBC model specialists and process consultants when applying the new tools, especially when obtaining data for the LP tables.
In addition, KBC also agreed to identify at least 10¢/bbl of crude charge in new profit opportunities for the refinery.
null
Roundtable discussions
A roundtable discussion was held before any work occurred on any unit's process models. This was typically a 2-hr meeting designed to provide unit operating objectives, constraints, and key product properties to KBC.
KBC could then customize the simulation model to meet specific ConocoPhillips needs and also scope out potential opportunities for profit improvement.
Unit performance test runs
Early in the project, the team found that many of the process units had very little data available that could be used to calibrate the kinetic models. The refinery had recently completed test runs on the crude units, FCC, and vacuum gas oil hydrotreater; but the other units had not had a complete set of yield performance data taken in several years.
The ConocoPhillips planning staff recognized that the simulation model's quality and ultimately the LP model's accuracy would depend primarily on the quality of the performance data used for calibration.
The ConocoPhillips project coordinators and KBC worked with the refinery staff to define and complete test runs on many of the refinery's units. This resulted in a delay in completing the models; but ConocoPhillips used experienced coordinators from its corporate staff in Ponca City, Okla., which helped organize the test runs relatively quickly and led to high-quality data.
The key steps in the test run were:
1. Identify sample points required for the test and determine if new or modified sample stations would be required.
2. Identify mass balance and other flow meters that needed calibration before the test run.
3. Determine the laboratory tests required for each sample. In general, if the simulation model is required to predict a stream property, then a test for that stream is needed.
4. Identify a laboratory that can complete the required tests and supply appropriate sample containers to use in the field. The refinery decided to use a third-party lab for the test runs due to the large number of sample bombs that would be needed.
5. Meet with refinery operations, planning, and laboratory groups to discuss the requirements for Steps 1-4 and to schedule a test run date when the unit would be operating at typical, stable conditions.
6. Perform a walk-through inspection a few days before the test run to ensure all planned arrangements (sample points, meter calibrations, etc.) have been completed. Prepare sample tags for the test.
7. Schedule an extra operator on the test day to take the required samples and issue instructions to the operations team on the preparation and unit targets expected for the test run.
8. Check trends of key operating variables to ensure the unit is stable before taking samples.
9. Complete sampling and check containers for leaks. Deliver samples to the designated laboratory as quickly as possible.
10. Collect appropriate process data from the refinery historian.
Data reconciliation
After the project team successfully completed each test run, KBC started reconciling the performance data. This included correcting the orifice flow meters (for pressure, temperature, and specific gravity), closing mass, carbon, and hydrogen balances by adjusting appropriate flow rates, and comparing process unit KPIs with typical values from KBC's database.
Table 1 shows an example of this process for the straight-run diesel hydrotreater. In this case, KBC adjusted the unit charge rate and hydrogen makeup rate to close the balances.
KBC also found that some of the carbon and hydrogen analyses from the lab were inconsistent and therefore corrected these values using proprietary correlations based on density and distillation curves. The result was consistent data that gave performance results (hydrogen consumption, for example) that were consistent with other units of this type.
Model calibration
The KBC Profimatics SIM models were easily calibrated with the high-quality, reconciled data from the test runs. The SIM models automatically generate calibration factors that match the plant yields and properties in most cases. ConocoPhillips did not merely want to match the test run data, however, because it would routinely use the models to predict yields, properties, and unit operations at substantially different conditions.
Using input from unit and planning staff at LCR, KBC designed several step-off tests for typical feed and operating variable changes. ConocoPhillips then compared the results for each step-off case with typical unit performance or to pilot plant data if they were available.
In some cases, manual adjustments to the SIM model tuning factors was needed to match the shifts that ConocoPhillips expected. For example, for one of the hydrotreater models and using ConocoPhillips pilot plant data, KBC adjusted the activation energy for desulfurization (a tuning factor) to match the expected improvement in sulfur removal due to a given increase in unit bed temperatures.
This collaborative approach to model tuning ensured that the refinery would receive kinetic models that responded to feed and operating changes the same way the actual refinery unit did. The process also improved ConocoPhillips' confidence in the model's predictions, which made it easier to gain approval for implementing changes based on model results later in the program.
Unit monitoring tools
UMT development was typically started after test run data reconciliation and model calibration. From this preceding work, KBC developed a good understanding of the unit mass balance and modeling issues, which was useful when the UMTs were configured.
The UMTs were developed according to these steps:
1. Collect unit tag information from the data historian: tag name, description, units of measure, typical value, etc.
2. Configure the UMT to calculate flow meter corrections from appropriate pressure, temperature, and stream density data from the data historian.
3. Configure the UMT to calculate the unit mass balance and yields. In some cases, it had to account for extraneous feeds, such as refinery gas streams to the FCC LPG plant.
4. Configure calculations for unit KPIs. KBC started with a standard list tailored for each process unit and added additional KPIs specifically needed for the refinery's unit constraints, based on the roundtable discussions.
5. Configure the UMT to provide input and access output from the unit SIM model. The SIM model is executed automatically from the UMT using a macro program.
6. Select appropriate data to write to the process historian and create new tags for them. Configure the UMT utility to write the new tags to the historian.
7. Test the UMT with several actual plant data sets and debug as necessary.
After the UMTs were delivered to the refinery, KBC held informal, one-on-one training sessions with the plant engineers, typically lasting about an hour. In some cases, a few additional changes were needed after the UMTs were initiated.
The refinery found that if it routinely used the UMT, the process of importing and reconciling the plant data, running the model, and exporting the KPI and yield results took less than 30 min.
Schedule
The original project schedule was quite aggressive; the entire project was scheduled for completion in 9 months. The schedule slipped about 2 months during the project, primarily due to rescheduling the planned test runs for several units because of operating problems or a lack of unit feed availability. The other portions of the project generally met the planned schedule.
Test run execution to the initial model review meeting typically took 7 weeks. About half of this time consisted of obtaining and reconciling the laboratory results; the other half was needed to complete the model calibration.
After the model review, it typically took 10 weeks to revise the calibration and tuning and to complete the documentation that described the basis for calibration and step-off cases used for testing the model responses to key feed property and operating condition changes.
After the model was delivered, the UMT completion, testing, and final delivery took another 7 weeks on average. After each test run, therefore, it took about 6 months to complete the model and UMT for a given unit.
Project results
The model development project successfully met its objectives. The refinery's staff calibrated and validated the rigorous models, based on test run data. The refinery developed UMTs and linked them to the process models to allow comparison of actual performance vs. simulation predictions.
ConocoPhillips developed and implemented LP submodels, based on the more rigorous kinetic models, for the core refinery units: crude and vacuum towers, FCCU, vacuum gas oil hydrotreater, and catalytic reformers.
The project exceeded its profit improvement target of 10¢/bbl of crude. This was accomplished via a review of the unit operations at the roundtable discussions, testing the process effects and economics of several ideas using the new SIM models, and reviewing each idea in detail with ConocoPhillips staff.
The project team evaluated only six ideas using this detailed process, but each of them provided significant benefits.
Simulation model, reformer feed selection
The SIM models have been used at several ConocoPhillips refineries for case studies involving changes in feedstock or operating variables, as well as for maximizing unit profitability.
One refinery example of this model is for the catalytic reformer feed.
The refinery occasionally purchases naphtha from the US Gulf Coast market to supplement reformer feed produced internally in the crude units. It is often difficult to evaluate the value of these cargos because the distillation and paraffins, naphthenes, and aromatics (PNA) content varies considerably among the naphthas available.
Also, because the refinery recovers benzene for the chemicals market, the benzene yield for each feed contributes considerably to the economic value for each feed.
ConocoPhillips needed a method to estimate the yields of hydrogen, LPG, benzene, and overall C5+ reformate for each naphtha from the refinery's reformers, to calculate the overall value of each feed.
The refinery's simulation model was tuned to test run data and was then used to evaluate potential naphtha purchases. Scant feed property data for each cargo was available, but the refinery simulation model can estimate a full PNA content using carbon number distribution from a few distillation points and bulk PNA content.
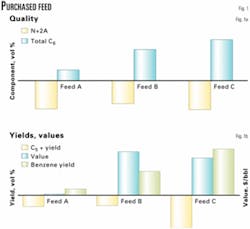
Fig. 1A shows the overall N+2A, a common measure of reformer feed quality, and total C6 content for each feed relative to the refinery base reformer feed.
An increment of each feedstock was added to the base refinery feed in the simulation model, and the yields and overall product value for each was then estimated using the model results.
Fig. 1B shows C5+ and benzene yields, as well as the relative value of the combined reformer yields to the refinery.
Feed A yields less C5+ than the base refinery feed and yields only slightly more benzene, resulting in an overall value that is about the same as the refinery base feed. Feed B yields slightly more C5+ than Feed A and much more benzene. The prevailing economics during the study favored benzene production; therefore, Feed B had a much higher value than Feed A.
Feed C yielded little C5+, but it yielded the most benzene out of the three cargos. Feed C, therefore, had a similar value to the refinery as Feed B.
Using these model results, The refinery gave better guidance to the ConocoPhillips trading group on the price that the refinery would be willing to pay for each of the three naphtha cargos.
UMT use
The UMTs were developed to help the refinery's engineers quickly reconcile and interpret plant yield and operating data. The tools have many uses, including identifying unit mechanical problems, uncovering inconsistencies in process and LP models vs. actual plant performance, and tracking the benefits of new catalysts or equipment changes.
Two examples of UMT use are tracking crude unit cut points and FCC performance tracking.
Tracking crude unit cut points
The UMTs for the crude and vacuum units are designed to calculate actual cut points between tower products, using plant distillation, density, and flow rate data. These cut points can be tracked as KPIs to show, for example, the plant's effectiveness in removing higher-value gas oil from vacuum residue.
The refinery's planning group developed the LP model using data generated from the KBC models. The crude unit tables in the LP included yields and properties for fractionated swing cuts, which optimize cut points between fractionator products that have flow rates that can vary according to prevailing market economics. It was not clear, however, if the cut point ranges for the swing cuts in the LP were consistent with actual plant performance.
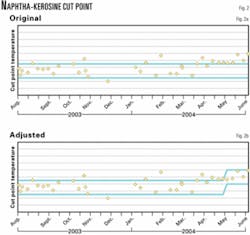
The planning group plotted fractionator cut points vs. the LP ranges (Fig. 2). The points represent cut points calculated using the crude-vacuum UMT, and the lines indicate the swing cut range in the LP.
Fig. 2A shows that the cut point range in the LP covers the normal operating envelope for winter months; after April, however, the actual cut points in the tower exceeded the LP range. This indicated that the LP would improperly represent summer operations, which potentially would change the operating plan and lower the refinery's profitability.
Fig. 2B shows the adjusted LP swing cut ranges after adjusting for the observed plant operation. The planning group decided to maintain the existing range for winter operation, but increase the summer swing cut range to match actual unit capability.
FCC performance tracking
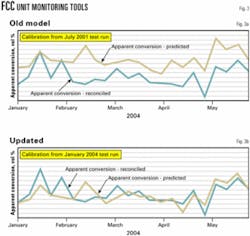
The UMT can evaluate the simulation model's performance (Fig. 3).
Fig. 3A shows the reconciled FCC conversion during a 4-month period in 2004 vs. model predictions using a calibration based on test run data from 2001. The model consistently overpredicts conversion; therefore, the model was recalibrated using data from January 2004.
After recalibration (Fig. 3B), the model predictions, although not perfect, show much better agreement with unit performance data.
LP benefits
The refinery originally initiated the operations planning and economics improvement project to improve the refinery LP using calibrated process simulation models. To date, the refinery has implemented new LP submodels for the core refinery units.
It plans to add base-delta models for other downstream units, such as the diesel hydrotreaters, in 2004. Although not yet proven, the updated LP should improve refinery-operating margin, by more closely matching the refinery's capability to crude selection and product slate.
In addition to planning improvements, the project tools can validate the LP's assumptions, as the following example shows.
Heavy-crude assay validation
One uncertainty in the refinery planning process is the accuracy of the crude assays used in the LP. Crude oil properties, such as density and boiling range, typically change over time even though the crude is drawn from the same region or wells. This makes it more difficult for refiners to plan the operations to maximize profitability if the raw material properties are uncertain.
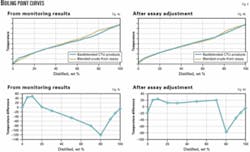
The refinery used the UMT in conjunction with the crude-vacuum unit model to check the assays used in the LP vs. what was actually processed in the refinery.
Fig. 4A compares the crude true boiling point curve expected from the original assay to the boiling distribution based on the backblended crude unit products. There is a large discrepancy, especially for the gas oil and vacuum residue regions of the curve.
The refinery's planning staff located several assays from different sources and dates for the primary crudes used in this blend.
The planning staff chose some of the lighter boiling versions of these assays, to obtain a much better match with the data (Fig. 4B). This significantly improved the LP representation of the refinery; the refinery's planning group took advantage of this during the next month by changing crude purchasing decisions.
Future work
The refinery's staff recognized early on in the project that the suite of modeling tools would require ongoing maintenance, updates, and training for new engineers. Since completing the model improvement project at yearend 2003, KBC has worked with the refinery's optimization team to continue to train refinery staff with hands-on examples of model and UMT use, update and repair models as needed, and identify additional profit opportunities for implementation.
The refinery is also considering extending the crude and vacuum unit models to include some key downstream units in a refinery-wide simulation flowsheet.
The refinery also continuously improves the quality of plant data used for the UMTs by adding key laboratory tests to improve unit yield calculations. The refinery also continues to add LP submodels based on the kinetic simulations for hydrotreaters, reformers, and other units.
Acknowledgments
The authors thank the Conoco- Phillips Lake Charles refinery's staff, the ConocoPhillips Coke Technology group, Ponca City, Okla., which made significant contributions to the modeling effort for the coker units at the Lake Charles refinery, and Arvin Paul and Gary Miller of ConocoPhillips.
Based on a presentation to the NPRA Plant Automation and Decision Support Conference, Sept. 20-21, 2004, San Antonio.
The authors
Kent Hickenbottom is an economics analyst for Conoco- Phillips, Lake Charles, La. He has 23 years' refinery experience at Phillips 66 Co., Conoco Inc., and ConocoPhillips. Hickenbottom has held positions in process engineering, process control, production scheduling and planning, and linear program modeling. He holds a BS in chemical engineering from the University of Nebraska and an MBA from the University of Houston.
Ron Gonzales is a staff technologist for ConocoPhillips's refining technical services division, Ponca City, Okla. His current responsibilities include process modeling, advanced process control, and fractionation technology. Before joining refining technical services in 2002, Gonzales worked in operations at the Billings, Mont., refinery for 10 years. At the refinery, he was involved in the operation of an FCC, crude and vacuum unit, and a hydrotreater.
John D. Pults is currently a team leader for refinery profit improvement and simulation implementation projects for KBC Advanced Technologies Inc., Houston. His optimization experience during 8 years with KBC has been primarily in catalytic naphtha reforming and isomerization, hydrotreating, fractionation, and gasoline blending. Before joining KBC, Pults worked at Amoco Petroleum Products for 8 years in research and development, operations, and technical service. He holds a BS from Rose-Hulman Institute of Technology, Terre Haute, Ind., and a PhD from Purdue University, West Lafayette, Ind., both in chemical engineering.
