Michigan Trenton-Black River opportunities identified with sample attribute mapping
Well site geologists, engineers, and drillers often include information in their final reports that rarely finds its way into prospect maps but that is highly relevant to gas and oil occurrence.
These data often include written descriptions of rock attributes, such as the occurrence of vugs, oil-gas shows, fractures, cement textures, and so on, that are difficult to quantify but which nevertheless comprise valuable clues concerning the presence or absence of hydrocarbons. In this article, we describe a technique to use these "sample attributes" to identify and map regional trends in the Trenton and Black River formations in the Michigan basin, but the technique can be applied to other regions and scales.
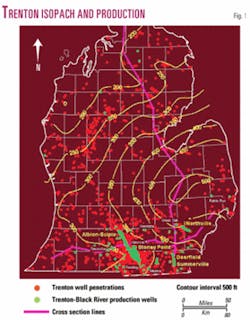
More than 3,700 wells have been drilled to the Ordovician Trenton and-or Black River formations in the US portion of the Michigan basin (Fig. 1). Mud log or sample log descriptions for 1,800 of these wells were entered into a digital lithology data base in a standardized format.
New exploration target areas for Albion-Scipio and Stoney Point-type fractured dolomite reservoirs are revealed by plotting the distribution of individual descriptive components or attributes of lithology (i.e., rhombic, vugs, dolomitic) from the data base on maps of the Michigan basin.
Ordovician reservoirs
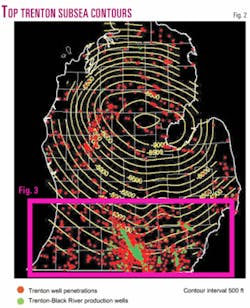
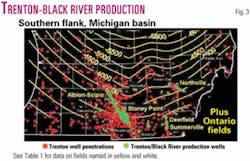
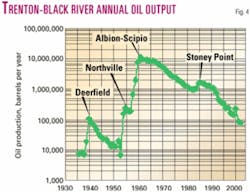
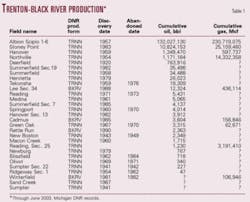
Trenton and Black River reservoirs have produced more than 146 million bbl of oil and 275 bcf of gas from fractured dolomite reservoirs on the southern flank of the Michigan structural basin (Figs. 2, 3, and 4). The majority of this production has come from five fields, Deerfield, Northville, the Albion-Scipio Trend, Hanover, and Stoney Point (Table 1).
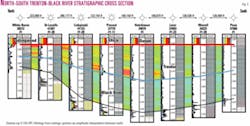
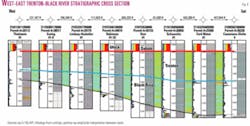
Regional north-south and west-east stratigraphic cross sections (Figs. 5 and 6) show the lithology, thickness, and gamma ray character of the Trenton and Black River in the Michigan basin (refer to Fig. 1 for cross section location).
These Ordovician reservoirs typically occur as narrow, linear features and are stratigraphic or strati-structural traps composed of dolomite in regionally tight limestone.
Original depositional strata were shallow-to-moderate water depth shelf carbonates.
Postburial diagenesis was produced by reactivation of basement faults as the result of orogenic activity in the Appalachians. The reservoirs formed through subsequent fracturing and the introduction of Mississippi-Valley-Type (MVT) fluids that precipitated white saddle dolomite and other MVT minerals.
Most Trenton-Black River fields are narrow (three quarters of a mile to 1 mile wide) and may be up to 30 miles long as in the case of Albion-Scipio field. Most are offset along their trace due to wrench faulting induced Riedel shears.1 Synclinal troughs or depressions also define the axes of these fields. Hydrocarbons are considered to be self-sourced from the Trenton-Black River carbonates (G. Prisca) and-or from the shaly Collingwood member found in the northern basin.1
Porosity and permeability vary widely in these fracture-related accumulations. Porosity is interconnected vuggy, to pinpoint, fracture, cavernous, and intercrystalline ranging from zero to 12%; permeability ranges from 0.01 md to 8,000 md or equipment measurement limits.1
Because of the fractured nature of these reservoirs, the continuity of individual reservoir intervals is impossible to predict, and this has often resulted in the drilling of dry holes or the need for multiple laterals from a single surface location to probe for hydrocarbons and fractures.
Hurley and Budros1 described how performance histories for wells showed poor correlation to porosity-feet values derived from logs.
Cavernous and fracture porosity contribute significantly to the inability to accurately calculate reserves and predict well performance for these reservoirs.
Sample attribute data base
A sample attribute data base was constructed using the regional lithology data obtained from driller's reports, sample logs, and mud logs. It contains the digital lithologic sample description (LSD) for the deepest well drilled in each 1 sq mile section (where available) of the State of Michigan through 1987.
LSD records for all wells drilled between 1988 and Sept. 15, 1991 (end date of the data base) are also included. These data were collected and entered into the data base from state records with first priority given to deep wells with mud logs available, followed by wells with geologist's descriptions, followed by wells with driller's descriptions only.
The LSD data include:
- The sample interval.
- The dominant lithology.
- Presence of oil show or cut and type of fluorescence where available.
- Porosity type and percent where available.
- Sample color.
- More detailed, descriptive notes about the particular sample including, for example, the presence of vugs, bioturbation, or the occurrence of stylolites.
The LSD data were loaded to a relational data base where the descriptive notes could be queried and where the irregular intervals of the sample descriptions could be summed to determine the thickness of the interval containing the particular descriptive component (i.e., feet of vugs or rhombs).
Formation tops were used to constrain queries to the Trenton-Black River interval.
Trenton-Black River intervals in wells containing a particular descriptive note were then posted to a base map for visualization.
Sample attribute mapping
The sample attributes in this data base were used in conjunction with geophysical well logs and other subsurface data2 to indicate proximity to oil and gas accumulations. Generally, cuttings and sample data are viewed one well at a time or via lithologic data posted to cross-sections.
Often, the presumed quality of the sample descriptions (i.e., reputation and experience of the well site geologist, vintage of log) or sample collection process at the well site (i.e., 10-ft samples, rig, boilerhousing) can change or modify the conclusions regarding the usefulness of any particular mud log, sample log, or cuttings description.
By viewing particular descriptive attributes from multiple sample descriptions and multiple wells simultaneously in map view, trends in the data may be observed that might otherwise go unnoticed and questionable sample quality can be filtered visually. Alternatively, sample descriptions from individual wells on the map can be spot checked via cross sections or the original mud log or sample log can be pulled for more detailed review.
Stacking individual attribute maps (i.e., stacking a map of the distribution of rhombic texture in the cuttings on top of a map of the distribution of vuggy texture observed in the cuttings) serves to further highlight potential trends in the cuttings descriptions. This methodology also serves to help normalize variability in the cuttings descriptions due to different individuals describing the cuttings using slightly different interpretation techniques at different times.
The regional cuttings data base contains dry hole as well as producing well descriptions; therefore, any particular textural attribute can usually be observed both in a producing field and outside a producing field. In the case of the Trenton-Black River fractured dolomite reservoirs, if producing wells in Albion-Scipio, Stoney Point, and Northville fields contain a particular textural element then that textural element is likely representative of these types of accumulations.
Results
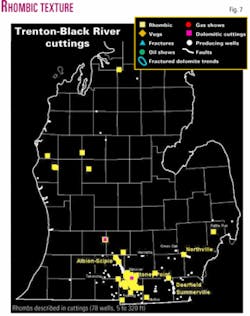
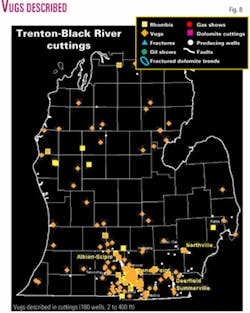
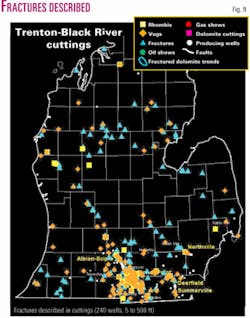
Maps produced from the sample attributes are shown in Figs. 7-12.
Fig. 7 shows the distribution of wells with rhombic texture (yellow squares) observed in the Trenton-Black River stratigraphic interval. Rhombic texture in cuttings is an indicator of saddle dolomite caused by MVT hydrothermal processes and suggests proximity to faulting or fracturing. Note that the area in and around Albion-Scipio and Stoney Point fields contains numerous wells with rhombic texture described in the cuttings. Outside these areas less than 10 cuttings descriptions in the data base contain this textural attribute.
Fig. 8 shows the distribution of wells with vugs (orange diamonds) described in the cuttings overlaid on the rhombic attribute map. Vugs are described in the cuttings in many wells in the Albion-Scipio, Stoney Point, Northville, and Summerville field areas, and at least 40 wells have vugs described in the cuttings outside these areas.
Fig. 9 shows the distribution of wells with fractures (blue triangles) described in the cuttings superimposed on the vugs and rhombic attribute maps. Linear trends are obvious in the map, some of which line up with Albion-Scipio, Stoney Point, and Northville fields, suggesting that the underlying structural elements, fractures, and faults may extend into or be present in other areas of the Michigan basin.
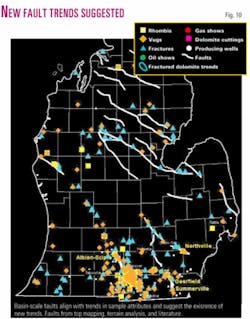
Basin-scale fault trends previously identified through regional-scale subsurface mapping3or cited in the literature are shown in Fig. 10 overlaid with the map showing the distribution of rhombic, vug, and fracture attributes in the cuttings descriptions.
Many of the rhombic, vug, and fracture texture wells line up along these fault trends or suggest that other fault trends exist in the basin. For example, the fault and fracture trend forming Albion-Scipio field appears to extend to the northwest across several more counties and to possibly connect with a fault trend in Oceana County.
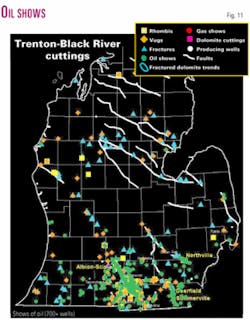
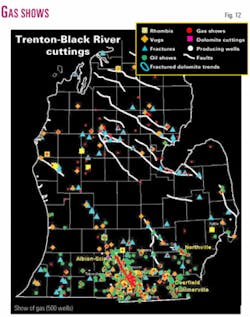
Figs. 11 and 12 are maps of wells with shows of oil (green dots, 700 wells) and gas (red dots, 500 wells), respectively, in the Trenton-Black River, stacked onto the cuttings textural attribute and fault trend map shown in Fig. 10.
Oil and gas shows are numerous in the wells in and around Albion-Scipio, Stoney Point, Northville, and Deerfield-Summerville fields. As might be expected, the southern flank of the Michigan basin is dominated by oil shows, and the structurally deeper central and northern portion of the basin is dominated by gas shows.
Many of the oil and gas shows in the Trenton-Black River interval outside the producing fields line up with the rhombic, vug, and fracture trends from the cuttings descriptions as well as with the independently derived fault trends suggesting a strong correlation between these various types of data.
Summary
Sample attribute maps can be used to highlight areas with potential for further attention and exploration.
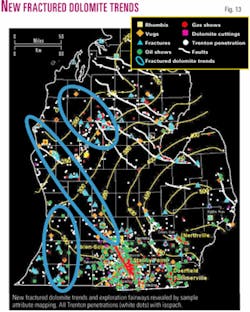
For example, ovals on Fig. 13 encircle potential areas where the sample attributes indicate fault and fracture trends likely exist in the basin and where Albion-Scipio and Stoney Point-type accumulations may still be hidden.
The Trenton-Black River isopach contours and Trenton-Black River penetrations without cuttings descriptions information in the data base (white dots) have been added to the map. Clearly multiple geographic areas exist in Michigan with exploration potential for oil and-or gas charged Ordovician fractured dolomite reservoirs.
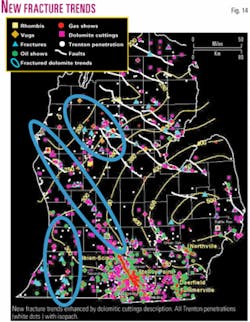
From a regional perspective, most Ordovician fractured dolomite reservoirs are composed of mixtures of dolomite and limestone. It is unusual for any individual well to penetrate an entire stratigraphic section of the Trenton-Black River where the lithology is 100% dolomite. It might be reasonable to expect a well site geologist, engineer, or driller to describe dolomitic limestone or limey dolomite given the nature of the cuttings collection and description process.
Considering these possibilities, a final map stack was constructed (Fig. 14) showing all previous data but with the addition of wells where the cuttings were described as being dolomitic (purple squares, Fig. 14) through the Trenton-Black River. Clear alignment can be observed between the previously described linear trends in the basin and those wells with dolomitic limestone described in the cuttings further supporting the likely location of new, previously unobserved fractured dolomite trends. Areas with exploration potential can also be observed in the far eastern and the far northern Michigan basin.
Sample attribute mapping can be a powerful tool in the search for hydrocarbons. It is not as quantitative as well logs or seismic, for example, but it conveys information these techniques do not and cannot. Used in conjunction with seismic, logs, detailed subsurface mapping, and other prospecting techniques, sample attribute mapping can reduce risk and help locate new exploration fairways and prospects.
Acknowledgments
We thank Carol Asiala for the visual basic programming. IHS Energy Log Services provided digital well logs. LandMark Corp. provided the GeoGraphix mapping and cross section software. US Department of Energy contracts supported parts of this work. Acknowledgment is made to the Donors of the American Chemical Society Petroleum Research Fund for partial support of this research.
References
- Hurley, Neil F., and Budros, R., "Albion-Scipio and Stoney Point fields, USA, Michigan Basin," in Beaumont, E.A., and Foster, N.H., eds., "Stratigraphic Traps I, Treatise of Petroleum Geology, Atlas of Oil and Gas Fields," AAPG, 1990, pp. 1-37.
- Everham, W.D., and Huntoon, J.E., "Subsurface databases: graphical display and error detection for stratigraphic interpretation in the Michigan Basin (abs.)," GSA Abstracts with Programs, Vol. 28, No. 7, 1996, p. 265.
- Wood, J.R., "Mapping large-scale faults in the Michigan basin using tops data," AAPG national meeting abs., Vol. 7, 2003.
The authors
A.S. "Buddy" Wylie ([email protected]) is a research scientist/engineer with Michigan Technological University. He worked for 19 years in petroleum exploration and reservoir characterization in a variety of positions for companies including Gulf, Chevron, Santa Fe Energy, and Mobil. His present interests include the continued development of log curve amplitude slicing and tomography for subsurface imaging of petroleum systems and reservoirs. He holds MS and BS degrees in geology from North Carolina State University and a PhD from Michigan Tech.
James R. Wood ([email protected]) is professor of geology at MTU and director of its subsurface visualization laboratory. He was with Chevron Oil Field Research Co. from 1978 to 1990. His present interests include petroleum geology and surface geochemistry as well as computer-based mapping of the subsurface. He received a PhD from Johns Hopkins University.
William B. Harrison III (william.harrison_iii@ wmich.edu) has more than 20 years, experience in Michigan stratigraphy and petroleum geology. He founded and serves as director of the Michigan Core Research Laboratory, which is the Michigan center for the Petroleum Technology Transfer Council. He received a PhD from the University of Cincinnati, where he studied sedimentology and paleontology.
