Modification proposed for SRK equation of state
E.M. Mansour
S.M. Desouky
M.H. Batanoni
M.R. Mahmoud
Egyptian Petroleum Research Institute
Cairo
A.B. Farag
F.S. El-Dars
Helwan University
Cairo
This article presents a new modification for the Soave-Redlich-Kwong equation of state (SRKE) to determine reservoir fluid properties of Egyptian black oils.
Evaluation of the modification was performed with data from 43 black oil samples representing all active oil producing areas of Egypt. The practical outcome is needed by reservoir engineers for reservoir simulation to predict reservoir oil parameters in the absence of experimental data on pressure-volume-temperature analysis.
The modified Soave-Redlich-Kwong equation of state (MSRKE) enables prediction of the bubblepoint pressure, oil-formation volume factor, gas-oil ratio, oil density, crude oil gravity, gas gravity, and gas-formation volume factor of black oil with average relative errors of 0.01% to 10.713%.
Calculation sensitivity of the proposed MSRKE is determined by testing four oil samples collected from different locations in Egypt and comparing the measured PVT properties with those calculated from MSRKE. These evaluations show excellent agreement between the measured properties and calculated ones.
The estimation of reservoir liquid and gas properties from MSRKE is often needed when detailed laboratory PVT data are not available.
Properties
PVT properties are used to express the volumetric behavior of a reservoir fluid as a function of pressure and temperature.1 These properties depend on pressure, temperature, and chemical composition when the chemical compositions of crude oil differ from region to region.2
PVT properties are crucial for geophysicists and petroleum engineers for use in material-balance calculations, inflow performance calculations, well log analysis, reserve estimates and recoverable amounts, flow rate of oil or gas, and numerical reservoir simulations.3-5
PVT physical properties of primary interest in petroleum studies include bubblepoint pressure, oil-formation volume factor, solution gas-oil ratio, oil density, crude oil gravity, gas gravity, and gas-formation volume factor.6 These properties could be obtained by experimental measurements on representative samples of crude oil, but sometimes the absence of experimental data make the value of reservoir fluid properties necessary.
Actual data unavailability may result from sampling cost, uncertainty of measurements or obtained data, inaccessibility of fluid samples of reservoir hydrocarbon, or disability of samples obtaining.7 Hence, in case of the absence of the experimental measurements of PVT properties, it is necessary to use the empirically derived correlation or equations of states (EOS).8 9
Theoretical computations, collectively known as oil-system correlations (or PVT correlations), based on easily measurable parameters, are used to predict reservoir fluid properties. Such parameters include temperature, pressure, solubility, and API and gas gravities.10 Development of correlations for PVT calculations has been the subject of extensive research, resulting in numerous publications.
Such correlations can be unreliable predictors, depending mainly on the range of data at which they were originally developed and the geographical area with similar fluid compositions and API oil gravity. Furthermore, PVT correlations are based on easily measured field data, such as reservoir pressure, reservoir temperature, and oil and gas specific gravities.
The currently available PVT simulator predicts the physical properties of reservoir fluids with varying degrees of accuracy based on the type of the model used, the nature of fluid, and the prevailing conditions.11 Hence, petroleum engineers have traditionally used EOS to predict the volumetric and phase behavior of a wide variety of reservoir fluids.
This predictive tool is of great importance during an evaluation of newly discovered reservoirs, in design and management of oil-recovery projects during the various stages of the reservoir exploitation.12 The Soave-Redlich-Kwong (SRK) equation of state has become one of the most widely used and accepted models for petroleum fluid property prediction. Many articles discuss the use of EOS models for predicting PVT reservoir fluid properties.
Equations of state
Extensive efforts had been made in the past 2 decades to improve the performance of equations of state. These include the move from two-constant to three-constant equations to enhance the accuracy of volumetric calculations.
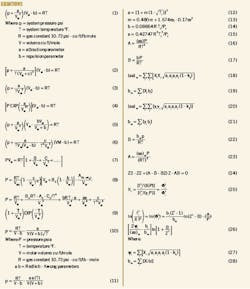
One of the earliest attempts to represent the behavior of real gases by an EOS was in 1873 in the proposed expression13 for PVT relationship shown in Equation 1 (accompanying box).
The symbol a is considered a measure of the intermolecular attractive forces between the molecules; b is known as the co-volume and considered to reflect the volume of molecules.6 Other researchers began attempts to improve Van der Waals EOS, which have continued for more than 100 years. Clausius proposed that the molecular attraction term is inversely proportional to temperature (Equation 2).14
The addition of the fourth constant, c, enables better agreement with data. However, mathematical manipulations required in the thermodynamic calculations are more difficult. So Berthelot removed the constant c, resulting in Equation 3.15
Dieterici handled the temperature dependence of the molecular attraction term in a different manner, as shown in Equation 4.16
Lorentz addressed the molecular volume term as shown in Equation 5.17
Wohl considered the effect of temperature on the molecular attraction term (Equation 6); the constants a, b, and c in Equations 2-6 have different values for different substances.18 Several investigations proposed virial types of EOS. Kammerlingh-Onnes proposed the virial equation of state shown in Equation 7.19 20
And B, C, …are not constants but functions of temperature called the second, third,…virial coefficients. Beattie and Bridgeman published a five-constant equation (Equation 8) that gives a satisfactory representation of volumetric properties except in the critical region.21
Benedict suggested a multi-parameter equation of state, known as the Benedict-Webb-Rubin (BWR) equation (Equation 9).22 This equation may be considered a modification of the Beattie-Bridgeman equation of state, where Ao, Bo, Co, a, b, c, α, and γ are eight adjustable parameters. The BWR equation suffers from disadvantages.23
Perhaps, the most important model for the modification of the van der Waals equation of state is the Redlich-Kwong (RK) equation.24 The RK cubic equation of state is the first equation that has been successfully applied to predicting vapor phase properties.25 26 It is the precursor of a family of simple and relatively precise equations of state (Equation 10).
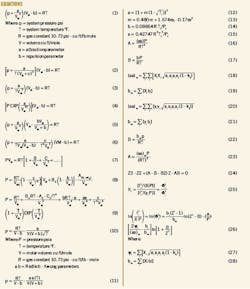
One of the most commonly and widely applied cubic equations of state was the Soave-Redlich-Kwong (SRK). Soave replaced the term (α/T0.5) in Equation 10 with a more general temperature-dependent term,27 denoted by aα (T), to give Equation 11,6 in which the correction parameter α(T) is defined by the relationship in Equation 12.
Soave correlated the parameter m with the centric factor ω to give Equation 13. A centric factor is defined by ω = – log pvap,r – 1, where pvap,r = p/pc = reduced vapor pressure at reduced temperature which is standard for the phase characterization of single and pure components. A centric factor ω is given in Equation 13.
• For pure substances, the equation parameters a and b are usually expressed as Equations 14-17.
• For mixtures, the equation parameters a and b are usually expressed as am and bm.
Calculate am and bm for a hydrocarbon liquid mixture with a composition of xi (Equations 18-19). Calculate am and bm for a hydrocarbon gas mixture with a composition of yi (Equations 20-23).
Replacing the molar volume V in the equation with (ZRT/p) and rearranging yield the compressibility factor of gas and liquid phases (Equation 24).
The equilibrium ratio Ki, that is Ki = yi/xi, can be redefined in terms of the fugacity of component (Equation 25).
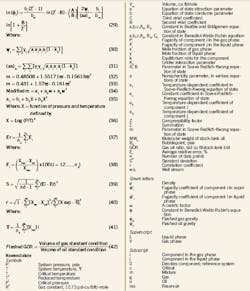
Soave proposed Equations 26-28 for the fugacity coefficient of component i in the liquid phase. Soave proposed the fugacity coefficient of component i in the gas phase (Equations 29-31).
Groboski and Daubert proposed a new expression for calculating parameter m in the proposed relationship in Equation 13, which originated from analyzing extensive experimental data for pure hydrocarbons and has the form of Equation 32.28
Sim and Daubert pointed out that, because the coefficients of Equation 32 were determined by analyzing vapor pressure data of low-molecular-weight hydrocarbons, it is unlikely that Equation 32 will suffice for high-molecular-weight petroleum fractions.29
Realizing that the centric factors for the heavy petroleum fractions are calculated from an equation such as the Edmister correlation18 or the Lee and Kesler correlation, the authors proposed Equation 33 for determining parameter m.30
SRK EOS accuracy
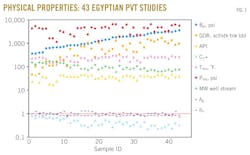
To determine the accuracy of the SRK equation of state along with m-parameter formula, the authors employed data of 43 PVT analysis studies (13 surface crude oil samples and 30 bottomhole crude oil samples). These data were collected from the literature for different oil well locations in Egypt and plotted in Fig. 1.
This figure shows a very large variation in data ranges of bubblepoint, gas-oil ratio, oil gravity, C7+, reservoir pressure, reservoir temperature, molecular weight of well stream, gas specific gravity, and oil specific gravity.
Table 1 shows the results, the basic characteristics of the collected Egyptian black oils, which consist of the values of arithmetic mean, maximum, minimum, and standard deviation for the 43 crude oil samples.
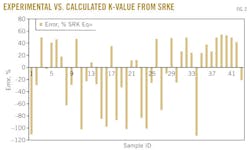
The data were used to determine the accuracy of the SRK EOS; Fig. 2 plots the results. Fig. 2 shows that the average relative errors between experimental K-values and calculated ones range from –111% to 55%. This error cannot be accepted to simulate PVT data.
SRK EOS modification
Because simulation of PVT data requires an accurate equation of state to predict reservoir parameters with minimum errors, m-equation is necessary to modify and improve the accuracy of the Soave-Redlich-Kwong. The term MSRKE will signify the modified SRK EOS.
A new form of the m-correlation is only a function of the centric factor (ω) and depends on oil sample properties such as reservoir pressure and reservoir temperature. The following steps comprise the adjustment procedure:
1. m-equation expressed by Equation 13 is proposed as shown in Equation 34.
2. The parameter a1 is mathematically expressed by Equation 35.
Fitting of the data listed in Fig. 2 with Equations 34 through 36 values of the constants b1, b2, b3, a2, and a2 yields the following: b1 = 0.07578; b2 = 2.28353; b3 = –0.86057; a2 = 0.10827; a2 = 0.1104.
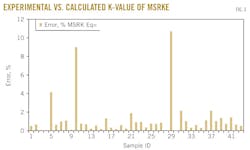
The resulting average relative errors are plotted in Fig. 3, from which the errors ranged from 0.01% to 10.713%.
Experiments
Four different oil samples were obtained from different Egyptian oil companies. The physical properties of the samples appear in Table 2.
The PVT analysis consists of a sample validation test, primary test, constant mass depletion (CMD), and differential liberation.
• Sample validation test. A validation test was carried out by measuring the opening pressures of a surface sample at separator temperature or bottomhole sample at reservoir temperature. If the difference between the sample cylinder and the operating pressure is less than or equal to 2% of the operating pressure, the sample is valid and analysis is continued.
• Primary test. For surface sample, a portion of separator oil is flashed to standard conditions (14.73 psia and 60° F.) and the dissolved gas-oil ratio, properties of dissolved gas and stock-tank oil, and separation gas are measured.
For bottomhole sample, a portion of the homogenous oil was flashed and properties of gas and oil are determined. The density and API gravity of the stock-tank oil was measured with a density meter; the gas and oil composition was measured with a chromatography analyzer.
• Constant mass depletion. The authors performed CMD experiments to simulate the pressure-volume relations of these hydrocarbon systems. The test's objective was to determine bubblepoint pressure, relative volume, density, and oil-formation volume factor above bubblepoint pressure.
Charging the fluid sample (oil and gas) into a visual PVT cell at reservoir temperature and at a pressure greater than the reservoir pressure agitates the cell regularly to ensure that the contents remain homogenous. The pressure is then reduced in steps at constant temperature by removing mercury from the cell, and the change in the total hydrocarbon volume is recorded for each pressure increment.
• Differential liberation. The differential liberation test describes the separation process taking place in the reservoir. The test is carried out on the reservoir oil samples and involves charging a visual PVT cell with a liquid sample at the bubblepoint pressure and reservoir temperature.
The cell is agitated regularly to ensure equilibrium between gas and oil. The pressure is reduced in steps, and all the liberated gas is removed and its volume measured at standard conditions. The volume of oil remaining is also measured at each pressure level. This step is continued to standard conditions (60° F.; 14.73 psia).
The experimental data obtained from this test include solution gas-oil ratio, gas gravity, gas-formation volume factor, oil density, and oil-formation volume factor below bubblepoint pressure.
Statistical error analysis
The accuracy of MSRKE is determined by studying the statistical errors. The error analysis consists of the average percent relative error, standard deviation, and correlation coefficient.
• Average percent relative error (Er). The average percent relative error is an identification of relative deviation of the predicted value from the experimental value in percent, as shown in Equation 36. The lower the value, the more equally distributed is the error between positive and negative values.
• Standard deviation (s). The standard deviation is a measure of the dispersion of predicted errors by a correlation and is expressed as Equation 38. A lower value implies a smaller degree of scatter around the average calculated errors.
• Correlation coefficient (r). The correlation coefficient represents the degree of success in reducing the standard deviation by regression analysis.
The correlation coefficient lies between 0 and 1. A value of 1 indicates a perfect correlation; a value of 0 implies no correlation at all among the given variables. The larger the value of r, the greater the reduction in the sum of squares of errors and the stronger the relationship between the independent variable and the dependent ones, expressed as Equation 39.
Results
The accuracy of the proposed MSRKE is determined from comparing the results of experimental work with corresponding values calculated from MSRKE. Four oil samples were tested to PVT analysis, two bottomhole samples and two surface samples. They were collected from different locations in Egypt.
Oil relative volume
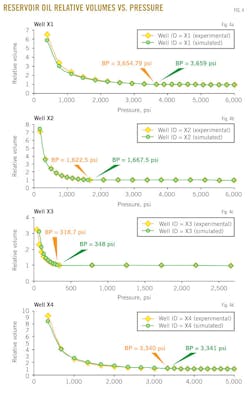
Figs. 4a-d show the results of the reservoir oil relative volume vs. pressure at reservoir temperature for the studied four wells X1, X2, X3, and X4, respectively.
This property is determined from the constant-mass (or constant-composition) depletion stage. In each figure, a dotted line represents oil relative volume from experimental data and the solid line represents oil relative volume predicted with the MSRKE. The plots show an excellent agreement between the measured data and calculated ones. In addition, the bubblepoint pressure was determined from each data plot, as shown in Table 3.
The relative volume is equal to 1 at the bubblepoint pressure. It can also be observed that the bubblepoint pressure is strongly affected by changing temperature, gas-oil ratio, and composition of gas and oil. It should be noted that no hydrocarbon material is removed from the cell; therefore, the composition of the total hydrocarbon mixture in the cell remains constant at the original composition.
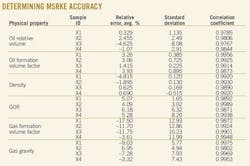
Applying the statistical error analyses technique yields the resulting average percent relative error, standard deviation, and correlation coefficient of the oil relative volume for four samples above and below the bubblepoint pressure (see error analysis in accompanying box). These values ensure the accuracy of the MSRKE
Oil-formation volume factor
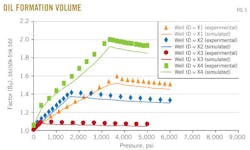
Fig. 5 shows the results of the oil-formation volume factor above and below bubblepoint pressure vs. pressure for the four wells X1, X2, X3, and X4.
The oil-formation volume factor above bubblepoint pressure was measured from constant-mass depletion stage, while below bubblepoint pressure was measured from differential liberation stage.
In each figure, the dotted line represents the oil-formation volume factor from experimental data and the solid line represents the oil-formation volume factor predicted with the MSRKE. The figure shows that the oil-formation volume factor above bubblepoint pressure increases as the pressure decreased due to oil expansion. Continuous decreasing pressure leads to gas releases.
Below bubblepoint pressure, a decrease in oil-formation volume factor with decreasing pressure is related to the gas releases. The amount of gas dissolved in the oil will decrease as pressure decreases until it reaches standard conditions, at which time the oil-formation volume factor equals 1.
The statistical error analysis results appear in the error-analysis box for the four samples above and below bubblepoint pressures. The evaluation ensures the good agreement between the measured data and calculated ones and consequently emphasizes the accuracy of the MSRKE.
Density
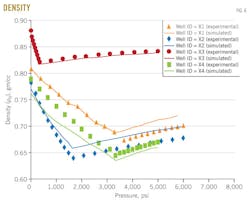
Fig. 6 shows the results of density vs. pressure above and below bubblepoint pressure for the studied four wells X1, X2, X3, and X4.
The density above bubblepoint pressure was measured from constant-mass depletion stage, and below bubblepoint pressure was measured from differential liberation stage. The dotted line represents density measurements and the solid line represents density predicted with the MSRKE. The figure indicates that the density decreases as the pressure increased above bubblepoint pressure.
At any pressure below the bubblepoint pressure, the amount of gas dissolved in the oil will release with further decreasing pressure. This will result in increased density as shown in Fig. 7. With continuous deceases in pressure to standard condition (p = 14.7 psia; T = 60º F.), the remaining oil becomes residual oil.
The densitometer calculates API gravity. This gravity, which is measured during the differential liberation stage, is usually less than than that of flashed stage.
The error-analysis box gives the average percentage relative error, standard deviation, and correlation coefficient for the studied sample values above and below bubblepoint pressure. The evaluation ensures that, the measured data agree well with the calculated ones.
Gas-oil ratio
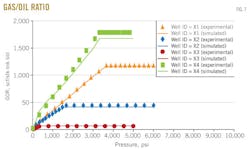
Fig. 7 shows the results of gas-oil ratio vs. pressure for the four wells X1, X2, X3, and X4.
Gas-oil ratio is measured from the differential liberation stage. In each figure, the dotted line represents gas-oil ratio from experimental data, and the solid line represents gas-oil ratio predicted by the MSRKE. Gas-oil ratio increases with increasing pressure at constant temperature. The gas-oil ratio, measured during the differential liberation stage, is greater than that of flashed gas-oil ratio.
This is due to the gas-oil ratio in a differential liberation stage being calculated by summing the standard volumes of the gas that is liberated in each pressure. Following this, at each pressure interval, the sum of the gas volumes was divided by residual oil volume to get the differential gas-oil ratio. In the case of calculating of flashed gas-oil ratio, the gas and oil flashed at standard conditions (p = 14.7 psia; T = 60º F.).
The flashed gas-oil ratio is determined from Equation 41.
Above the bubblepoint pressure, the gas-oil ratio is constant because the composition of the produced reservoir fluid is constant until the bubblepoint pressure is reached.
An excellent agreement between the measured and the calculated data was obtained. The values of statistical tools (average percentage relative error, standard deviation, and correlation coefficient) are listed in the error-analysis box, from which it can be observed that the data of well X1 results in a good evaluation. It shows an average percentage relative error range from 4.09 to 6.18 and standard deviation range from 1.65 to 8.20. All the values of correlation coefficient are close to 1.
Gas-formation volume factor
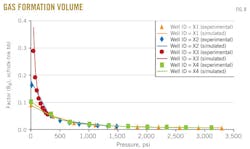
Fig. 8 shows the results of the gas-formation volume factor vs. pressure for the four wells X1, X2, X3, and X4.
The gas-oil ratio is measured in differential liberation stage. In each figure, the dotted line represents gas-formation volume factor from experimental data and the solid line represents gas-formation volume factor predicted with the MSRKE.
The gas-formation volume factor is a measure of how much the gas volume increases from reservoir to standard conditions. The changes in gas volume during production are larger than the changes in oil volume. The gas volume increases about as much as the pressure decreases.
Above the bubblepoint pressure, gas-formation volume factor is constant because no gas is liberated. There is also excellent agreement between the measured and calculated data.
The statistical error analysis clarifies the compatibility between the measured data and calculated ones.
Gas gravity
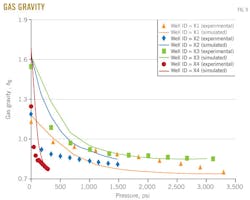
Fig. 9 shows the results of the gas gravity vs. pressure for the four wells X1, X2, X3, and X4. These results are calculated from a differential study test.
In each figure, the dotted line represents gas gravity from experimental data and the solid line represents gas gravity predicted with the MSRKE
As the pressure is further decreases, the content of heavier compounds in the gas will increase. This is reflected in increasing gas gravity with decreasing pressure.
References
1. Karen, S.P., and Peter, L.C., "Phase Behavior of Petroleum Reservoir Fluids," New York: Taylor & Francis Group, 2007, p. 41.
2. Muhammad, A.M., " Evaluation of empirically derived PVT properties for Middle East crude oils," Journal of Petroleum Science and Engineering, Vol. 42 (2004), pp. 209-21.
3. Omole, O., Falode, O.A., and Deng, A.D., "Prediction of Nigerian crude oil viscosity using artificial neural network," Petroleum & Coal, International Journal for Petroleum Processing, Vol. 51 (2009), pp. 172-178.
4. Osman, E.A., and Al-Marhoun, M.A., "Artificial neural networks models for predicting PVT properties of oil field brines," proceedings, 14th SPE Middle East Oil and Gas Show and Conference, Mar. 12-15, 2005, Manama, Bahrain.
5. Sunday, O.O., Ali, S., and Abdul Azeez, A.R., "Predicting correlations properties of crude oil systems using type-2 fuzzy logic systems," Journal of Petroleum Science and Engineering, Vol. 38 (2011), pp. 10911-22.
6. Tarek, A., Equations of State and PVT Analysis, 3rd ed., Houston: Gulf Publishing Co., 2007, p. 32.
7. Jalil, A., and Tahmasebi, P., "Comparative evaluation of back-propagation neural network learning algorithms and empirical correlations for prediction of oil PVT properties in Iran oilfields," Journal of Petroleum Science and Engineering, Vol. 78 (2011), pp. 464-75.
8. Osman, E.A., Wahhab, A., and Al-Marhoun, M.A., "Prediction of Oil Properties using Neural Networks," Paper No. 68233, SPE Middle East Oil Show Conference, Mar. 17-20, 2001, Manama, Bahrain.
9. Eissa, M.S., Hussam, M.G., Khaled, A.F., and Mohamed, H.S., "Modeling Approach for Predicting PVT Data," Engineering Journal of the University of Qatar, Vol. 17 (2004), pp. 11-28.
10. Sarit, D., and Gupta, J.P., "PVT correlations for Indian crude using artificial neural networks," Journal of Petroleum Science and Engineering, Vol. (2012), pp. 72, 93-109.
11. El-Sebakhy, E.A., "Forecasting PVT properties of crude oil systems based on support vector machines modeling scheme," Journal of Petroleum Science and Engineering, Vol. 64 (2009), pp. 25-34.
12. Reyadh, A.A., Abdulla, S.A., Mohamed, A., and Maher, A.A., "EOS tuning to model full field crude oil properties using multiple well fluid PVT analysis," Journal of Petroleum Science and Engineering, Vol. 26 (2000), pp. 291-300.
13. Van der Waals, J.D. "Over de Continuiteit van den Gas-en Vloeistof-toestand," dissertation, 1873, University of Leiden, the Netherlands.
14. Clausius, R. "Ueber des Verhalten der Kohlensaure in Begug auf Druck, Volumen and Temperatur," Ann. Phys. Chem., Vol. 9, (1880), p. 337.
15. Berthelot, D.J., "Sur Une Méthode Purement Physique Pour La Détermination des Poids Moléculaires des Gaz et des Poids Atomiques de Leurs Éléments," Journal of Physics, Vol. 3 (1899), p. 263.
16. Dieterici, C., "Ueber den kritischen Zustand," Ann. Physik., Vol. 69 (1899), p. 685.
17. Lorentz, Wied., Ann. Vol. 12 (1881), No. 127, p. 660.
18. Wohl, K.Z., Physik. Chem., Vol. 133 (1927), p. 305.
19. Kammerlingh-Onnes, H.K., "Expression of the equation of state of gases and liquids by means of series," Communications from the Physical Laboratory of the University of Leiden, Vol. 71 (1901), pp. 3-25.
20. William, D.M., "The Properties of Petroleum Fluids Handbook," 2nd ed., Tulsa: PennWell Publishing Co., 1994, p. 148.
21. Beattie, J.A., and Bridgeman, O.C., "A New Equation of State for Fluids: I. Application to gaseous ethyl ether and carbon dioxide," Journal of American Chemical Society, Vol. 49 (1927), p. 1665-67.
22. Benedict, M., Webb, G.B., and Rubin, L.C., "An Empirical Equation for Thermodynamic Properties of Light Hydrocarbons and Their Mixtures, 1. Methane, Ethane, Propane and n-Butane," Journal of Chemical Physics, Vol. 8 (1940), pp. 334-45.
23. Ya Song, W., and Richard, J.S., "Equations of State for the Calculation of Fluid Phase Equilibria," Computer Simulation and Physical Applications Group, School of Information Technology, Swinburne University of Technology, AIChE Journal, Vol. 46 (2000), pp. 169-96 .
24. Redlich, O., and Kwong, J.N.S., "On the Thermodynamics of Solutions. An Equation of State. Fugacities of Gaseous Solutions," Chemical Review, Vol. 44 (1949), p. 233.
25. Edmister, W.C., and Lee, B.I., Applied Hydrocarbons Thermodynamics, Vol. 1, 2nd ed., Houston: Gulf Publishing Co., 1984.
26. Souahi, F., Salim, S., Samia, A.A., Fairuz, K.K., and Chems, E.C., "Development of a new form for the alpha function of the Redlich-Kwong cubic equation of state," Fluid Phase Equilibria, Vol. 153 (1998), pp. 73-80.
27. Soave, G., "Equilibrium Constants from a Modified Redlich-Kwong Equation of State," Journal of Chemical Engineering Science, Vol. 27 (1972), p. 1197.
28. Graboski, M.S., and Daubert, T.E., ''A Modified Soave Equation of State for Phase Equilibrium Calculations,'' Industrial Engineering Process Design and Development, Vol. 17 (1978), p. 443.
29. Sim, W.J., and Daubert, T.E., "Prediction of Vapor-Liquid Equilibria of Undefined Mixtures," Ind. Eng. Chem. Process Des. Dev. Vol. 19 (1980), pp. 386-96.
30. Lee, B.I., and Kesler, M.G., "A generalized thermodynamic correlation based on three parameter corresponding states," AICHE Journal, Vol. 21 (1975), pp. 510-27.
The authors
More Oil & Gas Journal Current Issue Articles
More Oil & Gas Journal Archives Issue Articles
View Oil and Gas Articles on PennEnergy.com
