Shaker Screens—API standardizes criteria for solids separation
New API guidelines for testing and labeling shaker screens should simplify the screen selection process and provide screens that will efficiently filter cuttings from drilling mud. This article is the first of two that will provide a practical guide to shaker screen selection using API RP 13C-compliant screens.
In December 2004, the American Petroleum Institute’s Subcommittee 13 approved and published Recommended Practice (RP) 13C, “Recommended Practice on Drilling Fluids Processing Systems Evaluation.” This document combines and updates two previous documents: API RP 13C and API RP 13E. The December 2004 document was also approved by the International Organization for Standardization and carries the designation ISO 13501.
New API RP 13C
The new recommended practice covers a variety of subjects, but the discussion in this article is limited predominantly to the test that describes the openings on a shaker screen by comparing it to a known standard (US test sieves calibrated according to ASTM E-11).
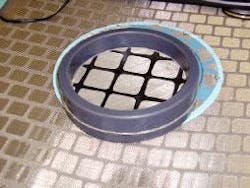
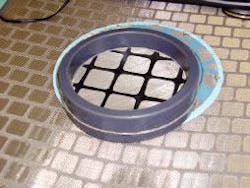
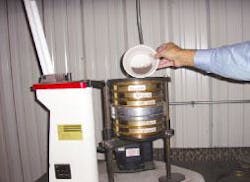
API RP 13C describes how a section of a shaker screen is properly mounted in a holder (Fig. 1) which is then put in the middle of a stack of calibrated US test sieves. The sieves and test screen are mounted on a Ro-Tap (orbital shaker with a tapping arm) and a defined master grit sample (aluminum oxide) is sieved (Fig. 2). The amount of grit on each screen is calculated and graphed. This process defines the absolute D100 separation of grit in microns (µm).
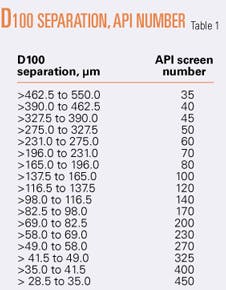
Any particle larger than the μm value will not pass through the screen. This value is then compared to Table 5 in the API RP 13C document (Table 1 in this article).
For example, if the separation of the test screen is 114.88 μm, the table will show that it compares closest to the US test 140 sieve. Therefore, this shaker screen would be classified as an API 140.
API’s Subcommittee 13 Task Group 5 also considered other testing methods, including:
• Sieve analysis with different types of media. Aluminum oxide was chosen because of repeatable results, low cost, and ease of use.
• Wet sieve analysis. This was tried but it required more equipment and was more difficult and expensive to perform, and the results were no better than the dry test.
• Standard shaker with a standard mud. A method to obtain a cut point curve was suggested with this test. What one must understand is that cut points are not invariant constants of any solids control device. Any variation of either the quantity or quality of the components of the standard mud will yield different results.
This also relates to the screen performance. The same screen on a different shaker with different drilling fluid properties will give different results. The only certainty was that the screen openings would remain the same; a method to describe the openings was therefore chosen for screen testing.
It is important to note that API RP 13C states that this test only describes the openings of the screen and does not predict the performance of the screen. The advantage of the current test is not only that can any screens in existence today with typically square or rectangular openings be tested, but also that any new screens yet to be invented with openings of any shape can be tested with the same procedures. Therefore, no manufacturer should complain that API RP 13C does not accurately describe the openings of its screens. Complaints of this nature may reflect a long history of screen mislabeling.
New dry-sieve test
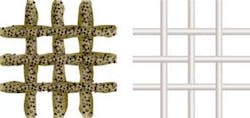
The new test is a dry-sieve test giving the D100. This is the worst-case scenario and will de-rate most screens to some degree. In actual use the wires of the shaker screen will be coated with drilling fluid, which will make the effective openings of the screen smaller than the dry-sieve test indicates (Fig. 3).
How much smaller depends on various factors including the properties of the fluid coating the wires, the operational parameters of the shaker being used, and the particle size distribution of the drilled solids presented to the screens. You can generally expect better separation performance than the API number indicates.
Two things will become apparent when API-compliant shaker screens are used:
1. You will find you were not screening as fine as previously thought.
2. You may not need to screen as fine as previously thought.
For example, if you have been using one manufacturer’s screens labeled Number 210 with good results (i.e., the screen was keeping the drilled solids in the allowable range without excessive dilution and giving reasonable life), then that screen is acceptable for what you are doing.
There is a good possibility, however, it isn’t a 210-mesh screen (according to the current API test); it might actually be an API 140 (which is what the API test indicated for some screens previously called 210 mesh). The screen hasn’t changed, just the way it was tested and labeled.
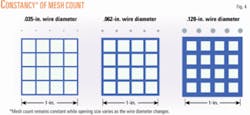
The definition of “mesh” is the number of openings/inch of the screen. However, mesh never defines the size of the openings on a screen, or the size particles the screen would remove. If the diameters of the wires are different, the mesh can stay the same, but the openings will be different (Fig. 4).
Today, because layered screens are most prevalent and the multiple layers give many different size openings (Fig. 5) the mesh count would vary depending on the starting point. For these and other reasons, API RP 13C does not refer to or classify screens by mesh.
Comparing shaker screens
Sales literature may claim that a screen was tested “in actual field conditions” and “our test showed our screen performed better than the API 13C test,” which may be true, but, these are two entirely different tests and different results should be expected. The API test only describes the openings; it is not a performance test.
API 13C-compliant screens easily allow an apple-to-apple comparison. If you want to compare performance of screens from different manufacturers, simply choose screens with the same API number. For example, choose two screens labeled API 170; in most cases the solids removed will be similar.
With the solids removal being similar, the issues to be addressed would be the relative capacity of the screen (related to conductance, which will be covered in detail in the conclusion of this series), screen life, and cost.
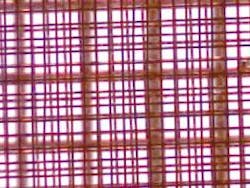
Using API-compliant screens will eliminate the confusion caused by mislabeled screens. For example, Fig. 6 shows four photomicrographs of four different screens from four different manufacturers. These are the screens that operators supplied to an independent lab for testing funded by API.
You can see that using what was formerly called the “mesh” of the screen (200 mesh, 180 mesh, etc.) could be very misleading. Unless you use a microscope to check all the screens, you might not know that screens with the same mesh number, from different manufacturers, could give substantially different results when it comes to solids removed. It is best to think of the old names of the screens as simply the part number when you need to order more.
New labels
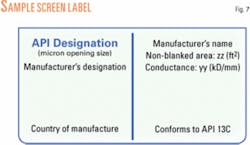
API RP 13C states that the new designation system will consist of no fewer than the following minimum elements:
• API screen designation or API number (this is to be printed two times larger than other information on the label)
• Equivalent aperture in μm.
• Conductance (kilodarcies/mm).
• Nonblanked screen area (sq ft).
• Manufacturer’s designation or part number.
API recommends that the label also include the manufacturer’s name and the country of manufacture or assembly, but these are optional.
The manufacturer can arrange the information any way it wants on a tag. This tag is to be permanently attached to the screen in a visible place. Fig. 7 is an example of what a label may look like.
Using API label information
If you have determined you need to use API 170 screens for the solids removal, then simply pick a screen labeled API 170 from any manufacturer. If you are using a set of API 170 screens and would like to have the cuttings discharged a little dryer, look for screens that are API 170 but have a higher conductance number.
In a comparison of flat screens, the way to increase conductance of a screen is to use smaller diameter wires (giving more open area), use less bonding material, or both. The result is higher conductance, but the screen life may be reduced.
If you have all the shaker capacity you need but would like longer screen life, look for a screen with the API number you need but a lower conductance. A screen with lower conductance probably has larger diameter wires and perhaps more bonding material that will probably increase the screen life.
Screen comparisons
Most screen manufacturers have tested or are in the process of testing their screens with the new API procedures. Some are still deciding if they will comply, while others have no intention at present to comply.
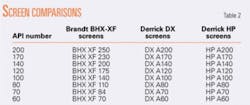
The author contacted the major screen manufacturers regarding API RP 13C testing. Two companies were willing to share information for this article: Derrick Equipment Co. and Brandt, a division of NationalOilwellVarco (Table 2).
This is a partial list covering the range of screens used most often. It should be regarded as preliminary, as changes are to be expected. Contact screen manufacturers for the most current information.
Choice, conductance
With API-compliant shaker screens you can make a more informed choice based on the uniform characteristics. You know what you are getting and there should be no surprises. This will make screen comparison and evaluation much easier because it eliminates the confusion caused by misleading labeling.
The concluding part of this series will focus on additional testing data and discussion of screen conductance. ✦
Bibliography
ASME Shale Shaker Committee, Drilling Fluids Processing Handbook. Elsevier Inc., 2005.
Recommended Practice on Drilling Fluids Processing Systems Evaluation (API RP 13C), American Petroleum Institute, Third Edition, December 2004.
API Subcommittee 13 Task Group 5 committee minutes on shaker screen tests.
The author Mark C. Morgan ([email protected]) is a solids control/waste/fluids specialist at Chevron ETC, Houston. He holds a BS in professional aviation from Louisiana Tech University, Ruston. Morgan is a member of AADE, SPE, and API and serves on various work groups and committees in each of the organizations.
