SEISMIC EMISSION TOMOGRAPHY-2: Seismic used to map permeability fields
This is the second of two parts on the use of seismic emission tomography (SET) to directly map reservoir permeability fields. The first part appeared last week (OGJ, Dec. 11, 2006, p. 37).
Burlington Resources Inc., now part of ConocoPhillips, in conjunction with STRM LLC, has conducted a series of field studies to test the validity of the fluid pressure (Pf) wave geomechanical model using SET for direct mapping of the reservoir scale permeability field.
Two studies were done: a tight gas sand discovery well in northern British Columbia and a frac in the Barnett shale in North Texas. Data for both studies were acquired and processed by MicroSeismic Inc., Houston, with further processing of the raw SET data and analysis by STRM. The following criteria were used to determine the success of the technology.
- Acoustic energy (AE) emission trends should parallel known tectonic trends of folds, faults, and jointing.
- A change in fluid pressure at the well should produce AE patterns consistent with known tectonic trends, e.g., jointing, faulting, etc.
- The AE patterns produced by the ΔPf should statistically parallel directions of maximum shear stress for Mohr Coulomb failure criteria consistent with the ambient Shmax.
- The AE emissions must be demonstrably related to crack failure.
- It should be possible to acquire data in a production environment.
Field study 1
The British Columbia study was conducted on a tight gas sand discovery well in the Canadian Rockies Foothills belt.
An initial network of nine 6-channel Kinemetric K2 portable seismic stations was established to monitor a cube with an 8x8 km map area and a 4-km depth. Each station consisted of one 3C and three 1C Sercel geophones for a total of 54 channels for the entire network.
Three stratigraphic intervals were monitored during the study period, which extended over a month. The lowest two intervals were flow tests, and the third was a frac.
Various adverse field conditions caused the successive loss of stations from nine for the first test to seven for the second and five for the third. Although all tests showed the predicted AE patterns, the two latter tests monitored by less than 54 channels resulted in significant aliasing and antenna effects that degraded resolution.
Fig. 3 (see Part 1, OGJ, Dec. 11, 2006, p. 37) shows the results of the first flow test. In the preflow state (unperturbed stress field) a set of NW-trending bands of high AE is most prominent. These trends parallel the major tectonic trends defined by folding and faulting. The band that passes through the well is coincident with the faulted anticline into which the well has been drilled.
A second NE-trending set of directions is present as a rippling effect superposed on the NW-trending bands. This trend parallels the dominant NE-trending joint sets. A NNW set of AE trends parallels a second set of known joint directions. The high AE bands are geographically stable; however, the locations of individual AE highs on the bands vary on a second by second basis.
Fig. 3 shows a dramatic contrast between the unperturbed (ambient) stress state and the perturbed state. As the Pf wave geomechanical model predicts, the AE emissions shift to those directions favorably oriented for Mohr Coulomb shear failure (NE and NNW trends) while AE emissions for those directions unfavorably oriented (NW trends) are suppressed relative to the favorable ones.
All the remaining tests showed results consistent with the model predictions. In addition to the reorganization of the AE field in response to the flow test, the variation in the maximum energy value (Emax in volts) for each of the SET cubes is consistent with energy changes expected during flow tests (Emax decrease) and fracs (Emax increase). Energy changes were two orders of magnitude.
Field study 2
The second field study, a frac in the Barnett shale, was focused on using SET in a production environment and comparing the results with those acquired by downhole monitoring.
The latter goal was meant to confirm that the primary AE emissions being recorded and processed were the product of rock failure.
For this study a much denser geophone network was used. The network, a Sercel 408 system consisting of 97 3C geophones, was distributed over a 2.5 sq mile area around the horizontal treatment well. The frac was monitored over a 3-day period consisting of a day before and a day during and after the frac. Pinnacle Technologies handled the downhole monitoring.
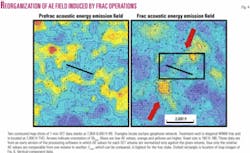
Fig. 4 shows the effects of changing fluid pressure on the organization of the AE field. Although the prefrac slice AE field shows some degree of organization as reflected in the NE and NW trends of the AE bands, the field is relatively disorganized compared to that induced by the frac.
The frac state stack shows the condition of the field at the time when wellhead pressure first reached the critical value at which fracturing began. Although the general organization of the field and the location of high AE bands remain stable for as much as 30 min, as with the ambient field the high AE loci on the bands change location but do so systematically.
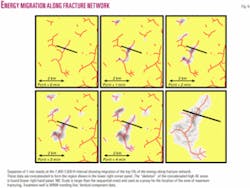
The regions of high AE are observed to migrate outwards from the treatment well at about 60 fps in a manner consistent with crack propagation. The systematic migration of the energy also provides a means of more precisely locating the potential zones of highest permeability.
Earthquake and crack theory predict that the principal fracture should occupy the region of highest AE emission. This region is found by clamping out all but the top 5% of the energy values over a sequence of stacks revealing a set of regions of high AE systematically migrating along some path.
The sets of regions are concatenated and the center or “skeleton” of the summed high AE areas found. The “skeleton” is inferred to locate the fracture/fault fairway. The results of this process are shown in Fig. 5.
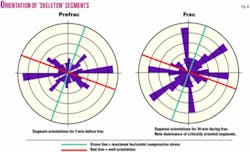
According to the Pf geomechanical model, the hydraulically linked fracture systems should statistically parallel directions for maximum shear stress. To test this we have broken the “skeleton” into segments and measured the orientation of skeleton segments for both the ambient and perturbed state. The results are shown in Fig. 6.
As is well known, fractures formed during fracs utilize preexisting joint sets. In this region of the Barnett there are two dominant joint sets; NE and WNW. New fracture networks are formed by a “laddering” of the two joints sets to form an “average” direction for the fracture itself.
In both the prefrac and frac states the WNW and NE sets combine to form “average” trends for the combined sets. In the prefrac state the dominant average trend is west while in the frac state two additional dominant average trends are formed consistent with maximum shear stress directions.
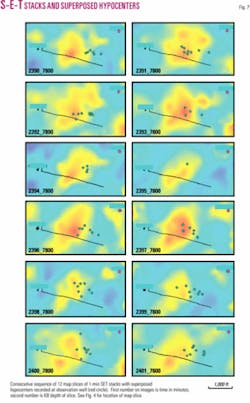
The comparison of the SET results to those obtained using downhole seismometers is shown in Fig. 7. These figures show a set of consecutive 1-min stacks of SET data. Hypocenter data (diamonds) recorded by the downhole instruments for the 1-min time interval of each stack, are superposed on the AE field map slice for the same 200-ft interval as the hypocenters.
The observation well location is given by the purple hexagon in the NE corner. The sequence starts 7 min before Pcrit (time number 2397) and extends 4 min beyond it. There are several caveats with respect to the data:
- The SET data show the sum of all AE energy released by the entire crack spectrum for the given time interval, whereas the hypocenters represent discrete events lasting on the order of a few seconds as opposed to the 60-sec SET stack time.
- The AE values are relative, not absolute, values. For each stack the values are normalized relative only to the AE values of that SET volume.
- The hypocenter data are filtered by distance from the observation well, thus the greater the distance from the well, the fewer resolvable events.
Given that the amount of AE measured by SET is a function of the total fracture energy emitted during the stack interval irrespective of fracture size and that there is a distance filtering bias in the hypocenter data, there is very reasonable agreement between the hypocenter data and the AE emission field. Note that the distribution of the hypocenter data generally reflects the shape of the higher AE values.
These results are interpreted to strongly support the conclusion that the SET data are the product of rock failure induced by a fluid pressure wave.
What is learned
Geometry and behavior of SET energy field images are consistent with of fracture/fault systems.
Dynamic behavior of SET energy fields is consistent with crack theory and Pf geomechanical model.
Time/space distribution of SET high AE energy agrees with hypocenter data.
All observations are consistent with the claim that our analysis of the SET-generated AE fields can image both the ambient fracture/fault network and the reservoir-scale permeability field geometry.
This imaging can be done using only a surface based seismic network in which the size of the mapped volume is limited only by the size of the network deployed.
We conclude that the set of studies we have conducted demonstrates that it should now be possible to use surface-based seismic networks to directly map the reservoir scale permeability field of fluid reservoirs. This capability promises to remove one of the major impediments to significantly increasing the efficiency of hydrocarbon production.
Acknowledgment
Burlington Resources provided the major funding for this work.
References
- Geiser, P.A., “Method for 4D permeability analysis of geologic fluid reservoirs,” US Patent 6389361 B1, 2002, and “Method and apparatus for imaging permeability pathways of geologic fluid reservoirs using seismic emission tomography,” US Patent 7127353 B2, 2006.
- Heffer, K.J., Fox, R.J., and McGill, C.A., “Novel techniques show links between reservoir flow directionality, earth stress, fault structure, and geomechanical changes in mature waterfloods,” SPE Annual Technical Conference and Exhibition, Dallas, Oct. 22-25, 1995, SPE 30711.
- Barton, C.A., Zoback, M.D., and Moos, D., “Fluid flow along potentially active faults in crystalline rock,” Geology, Vol. 23, No. 8, 1995, pp. 683-686.
- Ziv, A., and Rubin, A.M., “Static stress transfer and earthquake triggering: No lower threshold in sight?,” J. Geophys. Res., Vol. 105, No. B6, 2000, pp. 13,631-642.
- Biot, M.A., “Mechanics of deformation and acoustic propagation in porous media,” J. Appl. Physics, Vol. 33, 1962, p. 1,482-98.
- Tcheboterava, I., et al., “Seismic emission activity of earth’s crust in Northern Kanto, Japan,” Physics of the Earth and Planetary Interiors, Vol. 120, 2000, pp. 167-182
