Dynamic simulation improves gas plant SRU control-scheme selection
Simulation of Chevron Canada Resources Ltd.'s Kaybob South No. 3 gas plant's sulfur-recovery unit (SRU) has been successful in steady state using the HYSYS process simulator and a very close match obtained with the SULSIM steady-state simulation of the plant.
Dynamic simulation enables operating engineers to perform control-scheme selection, process selection and evaluation, and evaluation of other operating scenarios without unnecessary disruptions to a plant.
It was used here for the first time to study a modified Claus sulfur-recovery plant and the effect of three different control schemes on the efficiency of the plant, as indicated by the plant's air-demand analyzer's (ADA) response to acid-gas flow changes.
Three control schemes were studied: conventional control, a Smith Predictor, and a multiple cascade-control scheme.
The control schemes were tested with the major plant disturbances that were observed in operations-feed acid-gas flow changes of 20% up and down from the normal steady-state value.
The less-complex conventional control scheme handled the disturbances almost as well as a Smith Predictor and better than a multiple-cascade control scheme for the disturbances tested.
Modified Claus process
The modified Claus process is the primary method used worldwide to recover sulfur from sour natural gas.1
In addition to providing the correct feed for downstream catalytic processing, the process achieves significant sulfur conversion in the furnace.
Unfortunately, the furnace is also the source of problematic compounds, such as COS and CS2, that reduce sulfur recovery and make substantial contributions to sulfur emissions in the form of SO2 released from the tail-gas incinerator.
In North America, as well as in some other parts of the world, government legislation has imposed more-stringent guidelines on sulfur recovery and emissions.1
These tighter regulations, coupled with increased processing of sour crude and gas, demand that the Claus plant design and operation be improved to avoid costly post-construction attempts to increase sulfur recovery and reduce emissions. Reliable dynamic simulation at the design stage could greatly assist in this process.
Steady-state simulation
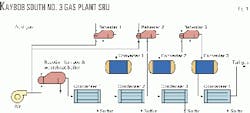
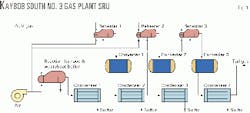
The Kaybob South No. 3 gas plant's SRU, at Fox Creek, Alta., is a modified Claus plant with three converters and acid gas-fired reheaters.
The acid gas feed to the plant is 1 million standard cu m/day (MMscmd; 350 MMscfd). It contains 75% H2S, 21.5% CO2, 0.5% hydrocarbons, and 2% water. Fig. 1 presents a schematic of the SRU.
An engineer has two choices to simulate any given process:
- Develop a custom simulation from scratch.
- Use a commercial dynamic simulator.
The authors chose the latter approach for this study and employed HYSYS, developed by Hyprotech Ltd., Calgary.
HYSYS has both steady state and dynamic capabilities. Additional information for the sulfur components was entered to simulate the SRU in HYSYS, specifically, the Gibb's Free Energies of the various sulfur species encountered in the SRU. Also, data from Berkowitz and from Stull and Prophet were regressed and entered.2 3
The reaction furnace was successfully modeled in HYSYS with the correlations developed by Western Research4 that are used in Bovar Inc.'s SULSIM steady-state sulfur process simulator. That provides the best correlation to actual plant operations currently available.5
These correlations were used as constraints on equilibrium for the components specified, namely CO, H2, COS, CS2, and elemental sulfur.
All other major unit operations in the SRU were also modeled in HYSYS according to Western Research's recommendations. Condensers were modeled as complete separations.
Hydrogen, CO, COS, and CS2 were specified as inerts along with 100% conversion of hydrocarbon in the acid gas direct-fired reheaters.
The COS and CS2 hydrolysis reactions are specified as an approach to equilibrium in the first converter, and H2, hydrocarbon, and CO are specified as inerts. In subsequent converter beds, COS and CS2 were also specified as inerts because their conversions are not observed after the first converter bed.
The stream values from the HYSYS steady-state simulation were compared to SULSIM for validation. The agreement was very close (usually within 0.01%). Where there was any difference, it was usually in a small concentration of a minor component that has little effect on the mass and energy balance.
Dynamic simulation
The physical dimensions of the plant were then incorporated into the HYSYS dynamic simulation. The 3-min delay observed in the ADA signal was also added in order to provide a realistic model of the dynamics of the plant's SRU. This provided a tuned simulation of the existing SRU.
The following three control schemes were then implemented:
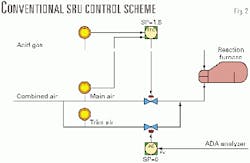
- A conventional control scheme with main air on ratio control and trim air on feedback from ADA (Fig. 2).
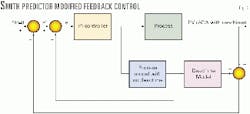
- Modified feedback with a Smith Predictor (Fig. 3).
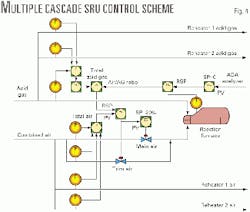
- A multiple-cascade scheme with trim air on ratio control biased by signal from ADA (Fig. 4).
For each of these schemes, the individual controllers were tuned before the plant was lined out at the normal operating value. This enabled a meaningful comparison of each scheme for the specified acid-gas flow disturbances of 200,000 scmd increase and decrease from the nominal value of 1 MMscmd.
Conventional control scheme
In the absence of specific tuning information, this control scheme was tuned as follows:
The main air-ratio controller was tuned as a PI controller with settings of Kc = 0.1 and Ti = 0.1 min, typically conservative settings for a flow controller6 but with a smaller gain in order to reduce possible interaction with the ADA trim-air feedback controller.
The ADA trim-air control loop has a significant deadtime (3 min) but a relatively short time constant (0.3 min). This loop was tuned with the Ziegler and Nichols process reaction curve technique.7 The recommendations of Cohen and Coon8 were applied because this loop has a large deadtime-to-time constant ratio.
The gain of the controller was detuned to achieve good performance. The final controller settings were Kc = 0.9 and ti = 0.9 min.
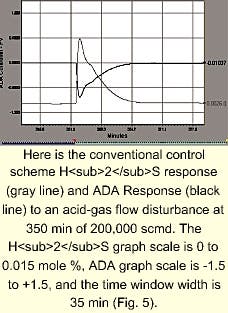
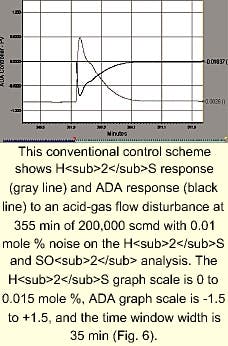
The control scheme was then tested for acid-gas flow changes of more than 200,000 scmd from the nominal value, as well as the addition of 0.01 mole % noise to the H2S and SO2 analysis. Fig. 5 shows the response of the ADA signal to the disturbance of 200,000 scmd up from the nominal value.
Settling times were about 20 min with little oscillation, except of course for the case with noise. The simulated response of Fig. 6 shows that the noise had little effect on the underlying response.
Smith Predictor control scheme
This controller used the classical block diagram of the Smith Predictor.9 A "perfect model" was assumed with the nondelayed ADA signal.
Although not realizable in practice, it was reasoned this would show the achievable limit of the technique.
Otherwise, the controllers were implemented according to the conventional control scheme with identical tuning parameters-again to provide a reasonable basis of comparison.
Fig. 7 shows the response of the scheme to the disturbance of 200,000 scmd up from the nominal value. This control scheme provided a marginal improvement over the conventional control scheme with settling times of the order of 15 min.
Multiple cascade control scheme
This control scheme consists of trim air on ratio control biased by signal from ADA and involves a cascade of four controllers and a multiplier.
This complexity is reduced somewhat in the Kaybob South case because it is impossible to implement a reaction-furnace temperature controller.
The following tuning strategy was adopted. Conservative values were chosen for controller gains, and integral times were chosen so that each successive inner loop was guaranteed to be four times faster than the previous outer loop. (This action guarantees operability of the cascaded loops.)
The following tuning constants were employed:
- ADA controller: Kc = 0.9 , which had to be reduced to 0.4 for stability, and ti = 0.9 min.
- Total-air flow controller: Kc = 0.1 and ti = 0.2 min.
- Trim-air position controller: Kc = 0.1 and ti = 0.05 min.
The control scheme was then tested for acid-gas flow changes of more than 200,000 scmd from the nominal value, as well as the addition of 0.01 mole % noise to the H2S and SO2 analysis.
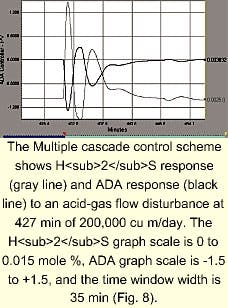
The response of the ADA signal (Fig. 8) shows the response of the scheme to the disturbance of 200,000 scmd up from the nominal value.
Settling times were about 17 min, but with considerable oscillation-the H2S analysis peaked at more than 1 mole % in all cases.
Reducing the ADA controller gain further by a factor of two had little effect on the oscillatory nature of this response.
The simulated response also shows that the noise had a small effect on the underlying response. The data seem to indicate, however, that this control scheme does not reject the feed disturbances very well.
References
- Strickland, J.F., Quinlan, M., Velasquez, D., Leppin, D., and Meyer, H., "Assessment of Recovery Capabilities and Costs of Tail Gas Clean-Up Processes," Proceedings of Sulfur 2000, San Francisco, pp. 263-302, Oct. 29-Nov. 1, 2000.
- Berkowitz, J., Chupka, W.A., Bromels, E., and Belford, R.L., "Vibrations and Thermodynamic Properties of Hexasulfur," Journal of Chemical Physics, Vol. 47 (1967), No. 11, pp. 4320-24.
- Stull, D.R., and Prophet, H., JANAF Thermochemical Tables, 2nd Edition, US National Bureau of Standards, June 1971.
- Sames, J.A., and Paskall, H.G., "Simulation of Reaction Kinetics for Split-Flow Sulfur Plants," Sulphur Recovery, Western Research, Calgary, 1990. Originally published as a paper for the Sulphur '85 conference, November 1985.
- Monnery, W.D., Svrcek, W.Y., and Behie, L.A., "Modeling the Modified Claus Process Reaction Furnace and Implications on Plant Design and Recovery," Canadian Journal of Chemical Engineering, Vol. 71, pp. 711-24, October 1993.
- Svrcek, W.Y., Mahoney, D.P., and Young, B.R., A Real-Time Approach to Process Control, John Wiley & Sons Ltd., Chichester, UK, 2000, p. 125.
- Ziegler, J.G., and N.B. Nichols, N.B., "Optimum Settings for Automatic Controllers," Transactions of the ASME, Vol. 64, p. 759, 1942.
- Cohen, G.H., and Coon, G.A., "Theoretical Consideration of Retarded Control," Transactions of the ASME, Vol. 75, p. 827, 1953.
- Seborg, D.E., Edgar, T.F., and Mellichamp, D.A., Process Dynamics and Control, John Wiley & Sons Inc., New York, 1989, p. 421.
The authors
Brent Young is an associate professor of chemical and petroleum engineering at the University of Calgary. He has 15 years' post-graduate experience in process modeling, simulation, and control and has taught in Australia, New Zealand, and Canada. Young holds a BE and a PhD from the University of Canterbury in chemical and process engineering. He is a registered professional engineer in Alberta.
John Baker is currently employed by Chevron Research & Development, Richmond, Calif., and was a process engineer at Chevron Canada Resources' Kaybob South No. 3 gas plant at the time of this project. He holds a BS from the University of Alberta and an MS from the University of Calgary. Baker is a registered professional engineer in Alberta.
Wayne Monnery is founder and president of Chem-Pet Process Technology Ltd., as well as an adjunct associate professor at the University of Calgary. He has taught courses in gas processing for the University of Calgary, the Institute of Gas Technology, UIS/Ecopetrol, Colombia, and UNI in Lima. He holds BS, MS, and PhD degrees from the University of Calgary in chemical engineering. He is a registered professional engineer in Alberta.
William Svrcek is a professor in chemical and petroleum engineering at the University of Calgary. He holds a BS and a PhD from the University of Alberta in chemical engineering and is a registered professional engineer in Alberta and Ontario.
