'Smart' raster logs can boost productivity of geologists
For the past 50 years, geologists have correlated well logs and built cross-sections on paper. Despite widespread computerization in the oil industry, they have not had the technology to completely replace inefficient paper methods-until recently.
One geologist said that with "smart" raster technology he correlated about 1,200 wells in two days. He said the task would have been impossible if he had had to use hard-copy logs.
During the 1980s and early 1990s, 3D seismic interpreters rapidly migrated out of the paper world onto interactive workstations, achieving astounding productivity gains in the process. Emboldened by this success, software vendors began offering new tools for the analysis and interpretation of digital well log data.
Many assumed that geologists would convert to digital methods as whole-heartedly as their geophysical colleagues. Certainly geologists adopted computer applications for many of their tasks, mapping in particular. But most continued to slide paper well logs across drafting tables, marking tops with a pencil, and cutting and pasting photocopies of their curves to construct wall-sized cross-sections-a familiar but tedious and time-consuming process.
The problem? Digital well logs were simply not available in many basins, either domestic or international. And the cost of digitizing large numbers of well logs often exceeded the budget. Paper, it appeared, was here to stay. On the information superhighway of the 1990s, geologists were stuck in the slow lane.
Raster technology, growth
Years ago, some oil company drafting departments began scanning well logs and importing these static "raster" images into PC drawing programs such as Canvas or CorelDraw. This allowed draftsmen to create final presentation cross-sections but had little impact on day-to-day work in most geologists' offices.
In 1995, things began to change. Denver start-up company Interpretive Imaging released the industry's first "smart" raster well log technology, combining a whole new data format called smartRASTERs with innovative log interpretation software called smartSECTION.
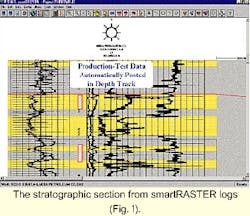
SmartRASTER well logs married digital depth information with standard raster bitmaps (Fig. 1). Every row of pixels, therefore, was calibrated with depth. This technological breakthrough enabled geologists to stretch, squeeze, splice, pick, and otherwise manipulate well logs onscreen with great speed and flexibility-similar to their digital counterparts but at a fraction of the cost.
Early adopters willing to take a risk in order to gain a competitive advantage bought the first systems and achieved the first successes.1
Today, four years after its introduction, smart raster technology is coming of age. Large and small oil companies have enthusiastically embraced the software and converted tens of thousands of paper well logs into smart raster format. Not surprisingly, software products competing with smartSECTION have sprung up in the last year or so, both validating and expanding the market. Neuralog, Petra, and Riley all offer raster-based cross-section programs for the PC now.
In addition, leading software developers such as GeoGraphix have recently added rasters to their existing array of digital formats. The latest smart raster software also can handle digital LAS logs as effectively as raster data. Finally, Interpretive Imaging recently merged with A2D Technologies, an industry leader in e-commerce, digitizing, and internet-based data management, providing oil companies with even faster, easier access to both smart raster and digital well log information.
The industry's raster data infrastructure is maturing. Smart raster technology is rapidly moving from the early adopters to the mainstream. As a result, geologists are finally experiencing productivity gains comparable to their geophysical associates.
Smart raster benefits
In this article, E&P professionals from five companies give their views to help readers better understand the uses and benefits of smart raster technology.
The professionals consistently emphasized two key advantages: speed and cost. Relative to paper, smart raster software is faster. Relative to digital, raster well logs are more cost-effective.
"Raster is faster, and cheaper," says Wayne Gibson, a geologist with Cross Timbers Oil Co. in Fort Worth. "Rasterizing is a normal step toward digitizing these days. Then depth calibration turns a 'dumb' raster into a 'smart' raster. That allows you to do almost everything you can with a digital well log, but it costs a whole lot less."
"In the early 90s, the company I worked for adopted geologic software that utilized digital data," explains Dennis Comis, chief information officer for Houston-based Frontera Resources. "For our own fields, we bit the bullet and spent the $50,000 to $100,000 to digitize the wells. But in fields we were just evaluating, we had to ask: 'Do we want to spend that kind of money?'
"The problem with digitizing is the higher cost-about $100-300 per log. Smart raster images cost about a tenth of that," says Dave O'Bright, a geologist in Chevron's Midland office. "It's always been a major pain to build cross-sections without computer-based data. A couple of sections could take days. Now you can make them in minutes."
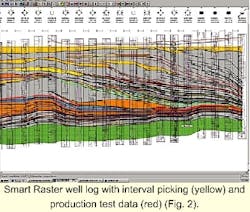
Rob Mathis, a geologist with Hilcorp Energy in Houston, agrees. "You can pick tops onscreen, save them to a database, and dump them out to a mapping file. You can make either structural or stratigraphic sections (Fig. 2). To change from one to the other is literally a couple clicks of a mouse. Re-hanging a section the old fashioned way would take several hours or days worth of work.
"Whether you're interested in regional exploration or field characterization, smart raster technology is an inexpensive way to get your logs computerized," says Ken Mallon, a consultant with Seis-Strat Services in Houston. "It's a speedy, accurate way of doing things."
When to use smart raster
Smart raster well logs are used today in a wide variety of basins, plays, and projects.
The professionals interviewed specifically mentioned the East Texas Cotton Valley reef play, the South Mississippi Tuscaloosa Trend, the Morrow formation of southeastern New Mexico, regional exploration in South Louisiana, field studies in the Permian Basin, re-development of an old California field, and operations in Azerbaijan and Georgia Republic. The number of wells involved ranged from 100 to 30,000.
What criteria do companies use to decide when and where smart raster technology is appropriate? The most likely projects are in areas with little or no digital well log data available, and either too many wells to correlate or too many geological interpretations to generate using traditional paper methods.
"When you go into a new country, there is no digital data. You have to make it yourself," says Dennis Comis. "In our Georgian operations, for example, we started with all raster logs and did lots of evaluations with them. It's an evolutionary process. Now we have all digital data. In Azerbaijan, I'd say 85% of our data is raster, 15% is digital."
"In early 1996, I was starting out from scratch in the East Texas basin," recalls Rob Mathis. "I had to evaluate that area quickly, but we had no digitized well logs. I knew sliding logs on top of a drafting table wasn't going to cut it. The quickest, most cost-effective way to get up and running was to scan about 1,000 well logs and use smartSECTION software, which had just come out."
Not long after Ken Mallon began consulting with Seis-Strat Services, the company won a contract to develop an old field in California with more than 1,000 wells and many sidetracked re-drills. "There was an enormous number of vintage paper logs dating back to the 1930s," he says. "Past operators hadn't drilled any new wells in years, so there were few modern logs. Old maps were not very helpful. Parts of the field had been mapped without faults and stratigraphic changes. I needed to re-correlate all these old logs to build a reliable geological picture. That's when I said, 'We have to do this on a workstation.'"
Mallon investigated all the commercial solutions available at the time. "As far as I was concerned, there were only two options: a UNIX-based package for digital logs, or this new PC-based smartSECTION technology. At a couple hundred dollars a crack, having 1,000 wells digitized would be a lot of up-front money. At less than $25 per log, the financial benefits of smart raster logs were clear."
While he was still geological manager for another company, Wayne Gibson purchased smart raster technology for Robert Johnson, one of his power users. "These weren't huge projects-our first one was about 100 logs-but we had a lot of demands on our time," he says. "An ideal cross-section study requires an orthogonal grid, where each well has a strike and a dip section through it. We were making cross-sections with 10 or more wells. With 100 logs, that's 20 cross-sections-an ambitious project in itself. To amplify the stratigraphic sections, however, we wanted to build at least half as many structural sections, bringing the total to 30 or more.
"Making all those on paper, sooner or later we ran out of energy and places to put them. We typically didn't generate enough sections to justify or illustrate a project for the rest of the team. That's why Robert looked into smart rasters. The first day his raster logs arrived, he made eight cross-sections." Today, Gibson uses the system himself to do field exploitation studies in the Permian and Midcontinent basins.
"Smart rasters are most functional in areas where you've got a tremendous number of wells," says Dave O'Bright. He should know. In the summer of 1998, Chevron and two other companies entered a consortium to rasterize every well in New Mexico's Lea and Eddy Counties-approximately 30,000 wells. "We purchased all that data because Chevron has acreage scattered throughout southeastern New Mexico. So it's difficult to target the logs in one specific area.
"Also, you don't want smart rasters for just your own wells. You can learn a lot from offset operators. For example, the area I'm working has seven or eight different pay intervals. So a lot of what I do involves analogies: 'This offset operator perf'd this interval and got this response. Have we done that in our wells yet?'"
There are circumstances, however, when digital well logs are still more appropriate, says O'Bright. "The advantage digital data has over smart rasters is that you can perform petrophysical calculations on the computer."
Gibson agrees: "Basically there are three times when digital well logs are better," he adds. "One is detailed petrophysical work. Another is tying well curves with seismic in a team environment. And a third is visualizing deviated or horizontal wells in relation to structure. Otherwise, rasters do just about everything digital logs do, only faster and less expensively."
Obtaining smart raster data
Originally, raster images were a by-product of the well log digitizing process.
The first step was to scan the paper log, creating an ordinary TIFF file that could be read by almost any graphical software program. "But they were just static images," says Mathis. "You couldn't do much except look at them onscreen."
The second step was to digitize the log curves from the raster image. At first, this was done manually on a digitizing tablet. Later, vectorizing technology helped automate the process. But human intervention was almost always required. Once the digital version of a log was available, the raster version was usually discarded.
Interpretive Imaging recognized the inherent value of these raster images and offered the first smartRASTER data processing service-visually correlating pixels with depth and tagging logs with a unique well ID so they could be retrieved using familiar data management tools. Today, add-on software allows users to depth-calibrate their own raster well logs if they desire. But few geologists can afford to scan and calibrate hundreds or thousands of logs. As Mathis says, "I don't want to spend my time doing that."
To obtain smart raster well logs, therefore, most companies first check the huge and growing libraries of existing data. "If the logs are already smart-rastered, it's possible I could get them the same afternoon over the internet," says Gibson. "The next best thing would be overnight mail."
However, when logs are not already in stock, companies send out their paper files for conversion and receive smart raster images on CD-ROM. "I've got more than 500 wells on my first CD," Mallon observes, "and there's room for more.
"We get the images on CDs and immediately load them onto our network drive," O'Bright explains. To see which curves are available for a particular well, he uses a GIS interface and simply clicks on the well symbol. "There's so much value in having that data at your fingertips. In two seconds, I see the image. Compare that to going down to the file room for a paper copy."
Most geologists notice that the greatest productivity gains occur when they obtain all of the well log data in their project areas in smart raster format, rather than approaching the process piecemeal. "We started with 200 wells in one part of this field," says Mallon. "If I had to do it over again, I'd want all the logs rasterized first thing. I've wasted a lot of time saying, 'I want this log and not that one.' Sure enough, six months later, I wish I'd had that one scanned, too."
That's why Chevron purchased all 30,000 logs in its core New Mexico area. "With digitized data, a problem comes up that I've seen too many times-you always want that one log that you didn't have digitized," says O'Bright. "That's the advantage of buying it all. One well log could have the critical piece of information that makes all the difference."
Using smart raster software
Comis said the best smart raster software is developed by earth scientists rather than programmers, by people who "feel the pain of what a geologist has to go through to create a cross-section."
Mallon agrees. "Geologists had a major role in the design of A2D's smartSECTION software. What I like best is that you can use these raster images just like paper logs on a table, only quicker. The software mimics the geologist's thought processes. And that's a good deal for users."
According to experienced users, smart raster well log interpretation software streamlines their work flows by enabling them to:
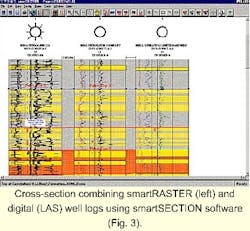
- Combine raster logs with digital LAS logs in the same application (Fig. 3).
- Rescale, stretch, squeeze, and drag-and-drop logs onscreen to facilitate correlation.
- Rearrange non-standard log tracks from old or international wells.
- Display well logs in true vertical depth.
- Preserve critical hand-written notes on old logs.
- Automatically post production-test data on well log depth tracks.
- Pick tops onscreen and automatically store them to a database.
- Rapidly pick porosity, net sand, net pay or gross interval thicknesses.
- Export tops and interval picks to leading mapping applications.
- Create structural or stratigraphic sections; change datums and re-hang instantly.
- Apply color, annotations and other graphics to plot presentation sections.
What kind of productivity improvements do geologists achieve with this type of workstation? "I've never been one to keep track of those things," Mallon comments. "All I know is that, in a half hour or hour, depending on what finishing touches I want, I've got a way to make beautiful-looking, presentation-quality cross-sections, store them as files and plot them any time I want.
"Productivity improvements are significant," says Mathis. "When I've got smart raster images, I can literally make a cross-section and take a finished product to the plotter in 15 minutes, 30 at most. To make the same cross-section with paper logs could easily have taken several hours or days."
"I needed to create a regional structure map recently," O'Bright says. "With smart raster software, I correlated approximately 1,200 well logs in two days' time. Because there were subsea depths already associated with the picks, I just exported them to another package and made my structure map. If I'd had to use hard copy logs, it would have been impossible to do this in the same timeframe."
Until recently, A2D's smartSECTION software had to be loaded to each geologist's PC. A new client/server, network version with an Oracle database enables colleagues to share data and results more efficiently.
As O'Bright notes: "We've got five users in our office now. With the network version, others will be able to access your data and use it to their advantage. And if you leave, the next person has all the data associated with that wellbore. It's not just sitting in a file cabinet somewhere."
Storing, managing files
Every geologist interviewed echoed Gibson's observation that storing rasters on a hard disk or network drive is a cost-effective alternative to physical paper file space.
"If you can convert your file room to raster images, then your paper data storage costs will go down significantly," Mathis stresses.
When he worked for a major oil company in 1996, Mathis attempted to convince management to have all the well log files scanned and stored on a server. "Their annual bill for offsite storage was huge. It was costing more than a million dollars a year to store well data that few people were using. They could have had at least 75% of that data scanned and made accessible to users. But old habits die hard. They didn't want to throw the paper away."
Comis said, "Traditional managers feel good walking into a gigantic file room, seeing all those well logs on a shelf. They think they have an asset there. At Frontera, we think all they have is a paper jungle. Our CEO and senior executives made a top-down decision to eliminate the file room."
Founded 3 years ago, Frontera Resources took a radically paperless approach to data management from the beginning. All technical documents-both raw materials and final output: well logs, maps, photographs, cross-sections, and engineering reports-are scanned, indexed, and stored on network file servers, accessible to all E&P professionals and partners via the company's extranet.
Armed with state-of-the-art laptops, scanners, video cameras, and Zip drives, Frontera's employees can both capture and carry huge amounts of raster information anywhere in the world.
"Smart rasters form an integral part of the overall plan," Comis explains. "Well logs are the building blocks we put into our smartSECTION software to make a cross-section. Then we create an output file of that cross-section, a digital replication, and upload it to a folder on the extranet. When our people are overseas, 15,000 miles away, they can log onto the internet, go to that folder, and download the file. If they need to, they can plot a hard-copy version for a presentation or offsite meeting."
However, even when users print a paper copy, they usually throw it away afterward, says Comis. "We have no file rooms or file clerks."
"Frontera has gone into places like Azerbaijan and Georgia and evaluated pretty much the whole country's asset base by being able to quickly and efficiently scan logs, maps, and other data," he concludes. "With knowledgeable people, we create value from a simple scanned image. I think it's safe to say that applying raster technology has provided our company a competitive edge in the international oil and gas arena."
Future of the technology
Just as the symbiosis of 3D seismic data and the interactive workstation revolutionized the geophysicist's workflow, the marriage of smart raster data with the new geologic workstation holds the same potential for geologists.
All they need is easy-to-use software, computerized data in a widely available and affordable format, and the belief that technology can make them more productive.
Once considered disposable, raster images are rapidly becoming indispensable to geologists who lack the "ultimate" LAS digital data. By some estimates, less than 5% of the total legacy well log data in North America have been converted to digital form.2 Some observers believe all of these data will be digitized eventually. Others consider that highly unlikely, given the time and costs involved. In either case, smart raster technology provides a desperately needed, highly productive alternative both to digital and paper approaches.
"I think smart raster well logs are here to stay," Ken Mallon observes, "unless, for some reason, the price for digital logs comes way down."
"There's no question that the use of smart raster logs is gaining momentum because they're fast and they're inexpensive," adds Wayne Gibson.
Rob Mathis agrees: "It's not as big as 3D seismic yet, but smart raster technology is a growing market. It has broad application to regional exploration, producing property acquisition, primary development, redevelopment of mature fields, enhanced recovery projects and property divestitures. It's also a tremendous way to store data. I believe scanning is the way to go, not just for well logs, but for any other data you'd like to see on a map or cross-section."
"Raster imaging, in my opinion, still hasn't hit the mainstream. But it's close," says Comis. "Many companies are just not ready to get rid of their paper yet. But eventually, people are going to put everything online, so they can share data and collaborate better with others."
"Paper will probably always be there in the smaller companies, independents and one- and two-man shops," Dave O'Bright concludes. "But if smart raster logs were available, I don't know that a geologist would ever choose paper. Much of geology is based on analogy. The more data you can get your hands on, and the quicker you can see it, the better prospector you'll be."
References
- See, for example, "Raster images offer low-cost well log preservation," OGJ, Dec. 16, 1996; "Raster logs may be basis for a geologic workstation," OGJ, Apr. 7, 1997; "A thing of beauty," Oil & Gas Investor, September 1997; and "Raster log technology: a new standard for log display/analysis," World Oil, May 1998.
- "Intelligent raster logs: a new industry standard," Petroleum Frontiers, Vol. 15, No. 1, 1998.
The Author
Jay E. Valusek is an independent writer and consultant specializing in information technology for petroleum exploration and production. He is the author of more than 100 articles in industry trade journals worldwide. For nine years, Valusek was senior staff writer for Landmark Graphics Corp. Previously, he was employed as a reservoir development geologist with the US offshore division of Pennzoil Co. in Houston. He graduated with honors from Wichita State University and earned an MS degree in geology from the Colorado School of Mines. E-mail: [email protected]


