Algorithm provides new EUR estimates for US shale plays
Rafael Sandrea
George Peels
IPC Petroleum Consultants Inc.
Tulsa
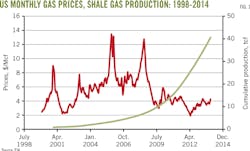
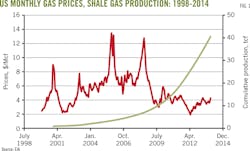
Since the early 2000s, US shale gas production has grown exponentially and reached a production level of 26 bcfd in 2013, 40% of total US gas output according to the US Energy Information Administration (EIA). This growth was driven by technological advances in horizontal drilling, multistage hydraulic fracturing, and a favorable price environment (Fig. 1).
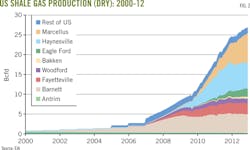
There are five main producing shale gas plays in the US: Barnett (Texas), Fayetteville (Arkansas), Haynesville (Louisiana), Marcellus (Pennsylvania, West Virginia, Ohio, and New York), and Woodford (Oklahoma). Additionally, EIA says that there are a few small plays that together contribute about 10% of the overall shale-play output (Fig. 2).
Already, four of the major plays have reached the onset of production decline. The only exception is the Marcellus with 84 tcf of technical reserves, roughly 1.4 times the combined reserves of the other four giant shale plays.
The Marcellus went on stream in 2008 and is already the biggest shale producer with an output of 7.81 bcfd in 2013. Its production is on a strong, exponential growth path that should be long-lasting considering the play's vast extent, about 94,000 sq miles.
This article reviews the production performance of the four leading shale gas plays that are in decline, establishes estimates for their ultimate recoverable reserves (EUR) based on field performance, and develops an algorithm for determining production potential of shale gas plays in general from their EURs.
Performance Analysis
A previous article OGJ, Dec. 3, 2012, p. 58, established that the behavior of shale gas plays is not conventional in that their high peak-production rates do not translate into a bigger field as measured by reserves. They do, however, follow a similar power-law relationship between reserves and production potential, but parallel to that of conventional natural gas fields. Classical logistic decline methodology was applied to the production history of the four large declining shale gas plays-Barnett , Fayetteville, Haynesville, and Woodford-in order to establish their EURs. The results were definitive for all except Haynesville.
Haynesville is a much bigger play than the others and was the last of the group to go on stream, barely 6 years ago. It is also a unique shale play in that it is highly overpressured, giving rise to abnormally high initial well rates (about three times the average initial well rates of the four other major shale plays) and to unusually high first-year well decline rates, about 86 %.
Because of these peculiarities, it's prudent to wait for additional production history for a more comprehensive analysis of Haynesville's EUR. Nonetheless, a reliable EUR is calculated later in this article, with a new algorithm.
The accompanying table summarizes the EUR values of the other three plays. Their comparable estimates of technical reserves, based on EIA's 2012 Annual Energy Outlook, also appear. In general, the technical reserves estimated for the three plays are roughly 53% more than the reserves calculated on the basis of their observed field performance.
The table also shows production rates for major shale plays 2010-13. The decline effects are somewhat restrained because the production numbers are annualized. The monthly stats do accentuate their decline trend.
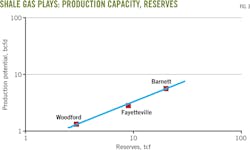
The actual field peak values and EURs obtained from decline analysis for the Barnett, Fayetteville, and Haynesville plays follow the well-established power law relationship between production potential and reserves, valid also for conventional oil and gas fields and for tight oil plays (Fig. 3). The specific correlation for shale gas is: q peak = 0.56 K 0.762
In this equation, "q peak" is the production potential of the play with units of bcfd and "K" is the reserve size of the play in tcf. The correlation coefficient (r2) is a high 0.997.
The table shows the calculated production potential values for the three shale plays using the above algorithm. In general, they are slightly higher than the actual field values.
The algorithm was then used to estimate the EUR of the Haynesville based on its field peak production of 7.25 bcfd. The calculated EUR is 29 tcf compared with EIA's estimate of 34 tcf for the play's technical reserves.
Subsequently, the equation was used to determine the production potential of the Marcellus based on the latest estimate (84 tcf) of its technical reserves as reported by the US Geological Survey (USGS). The resulting potential of 16 bcfd is roughly double its current output of 7.81 bcfd.
With the calculated EURs in this study and the original gas-in-place values estimated by the USGS, the expected recovery factors for the five major shale gas plays range from 4% (Haynesville) to 11% (Fayetteville), with an average of 5.4%.
The EIA's estimated recovery efficiency for all shale gas plays is 11%, or nearly double our findings and those of the USGS (table). The consistency of the calculated values of recovery efficiency reflects the reliability of the methodology used by the USGS in its assessment of the in-place values of the different shale plays.
Additionally, the algorithm developed here provides a quick and reliable estimate of production potential from early EUR estimates for shale gas plays. Our evaluation of field performance of major shale gas plays provides fresh values of key parameters such as their EURs and recovery efficiencies. These data are fundamental to planning for production and take-away infrastructure.
Bibliography
Browning, John, et al, "Study develops Fayetteville shale reserves, production forecast," OGJ, Jan. 6, 2014, p. 64.
Kaiser, Mark and Yu, Yunke, "Haynesville update - North Louisiana gas shale's drilling decline precipitous," OGJ, Dec. 2, 2013, p. 62.
Pike, William, "Shaletech: International Assessments Continue, Development Lagging," World Oil, December 2012.
Sandrea, Rafael, "World Crude Oil Supply through 2030," PennEnergy Research Center, March 2012.
Sandrea, Rafael, "U.S. Crude Oil Production Potential: A Stochastic Outlook through 2030," PennEnergy Research Center, June 2012.
Sandrea Rafael, "Evaluating production potential of mature US shale oil, gas plays," OGJ, Dec. 3, 2012, p. 58.
"World Shale Gas Resources: An Initial Assessment of 14 Regions Outside the United States," US Department of Energy, April 2011.
The authors
Rafael Sandrea ([email protected]) is president of IPC Petroleum Consultants Inc., Tulsa. He was formerly president and chief executive of ITS, a Caracas-based petroleum engineering firm he founded and directed for 30 years. He holds a PhD in petroleum engineering from Penn State University.
George Peels ([email protected]) is an independent information management consultant. Formerly, he was a co-founder of Jason Geosystems and vice-president of ITS. He holds a PhD in physics from Delft University, the Netherlands.


