Flow-field stress intensity exceeds simple pressure load at defect
Yue Cui Hui-qing Lan
Beijing Jiaotong University
Ren-yang He
China Special Equipment Inspection and Research Institute
Chao-hui Zhang
Beijing Jiaotong University
Beijing
Analysis of the residual fatigue life of X70-grade pipeline steel with a semi-ellipse defect shows the maximum stress intensity factor under the influence of the flow field to be higher than the value under a simple pressure load at the defect site. The flow field influences stress distribution at the inner wall of the pipe, but changes in concentrated stress advanced by the flow are not obvious at the defect's narrow flow path.
Increasing defect length to 30 mm from 10 mm in the axial direction decreases the residual fatigue life of the pipe to 60% of original life. When a 15-mm defect in the axial direction changes to a radial direction at the bottom surface of the pipe, the maximum concentrated stress gradually decreases, with residual fatigue life increasing 300.85% as long as original life is maintained at the defect site.
Parameter analysis of flow field and stress in this article show that pressure fluctuations should be minimized to increase residual fatigue life of high-strength steel pipes. Long defects in the axial direction of the pipe should be paid close attention to during on site monitoring because of their potential to fail catastrophically.
Steel defects
High-strength steel pipes in natural gas service inevitably suffer from defects, whether produced by slag inclusion in pipe manufacturing, mechanical manipulation, weld defects during installation, or hydrogen-induced cracking (HIC) during service.1 Accurate prediction of the residual fatigue life of pipelines is therefore crucial in the engineering design and integrity assessment of high-strength steel gas transmission pipelines.
Both plastic reserved energy and fatigue fracture resistance decrease when high-strength steel undergoes yield deformation.2-3 The eroding action of the flow field inside the pipe therefore accelerates defect growth and fracture failures in existing flaws. When pits appear on the internal face of the pipe, the expansion and extension of the pipe from inside to outside accelerate beyond whatever effects the transported medium might have on an internal corrosive environment.
The probability of defects on the internal surface increases over time because of the mechanical effect of the flow field and abrasion on the pipe. Defects can propagate rapidly in an unstable manner, eventually leading to pipe failure and economic losses.4 Catastrophic failure is also a possibility, raising the importance of monitoring growth of pitting defects in predicting remaining pipeline life.
Studies have found the defect-weakening coefficient does not influence the ratio of WT to radial dimension. Lukas studied the law of fatigue defect growth on austenitic stainless steel under a corrosive atmosphere at varying temperatures, proving applicability of the Paris–Erdogan formula for defect growth rate.5 Toyoda, et al., conducted numerical simulations on the growth of a polygon fatigue defect on a thin high-strength steel wall. Results showed concentrated stress as the cause of defect formation in high-strength steel pipes.6
Fluid–structure interaction
Changing flow conditions and loads on the inner pipe wall lead to structural deformation. Pipe status in turn affects the flow field to a certain degree, creating a fluid-structure interaction (FSI) with feedback inside the pipe. The pipe is always in FSI while operating.7
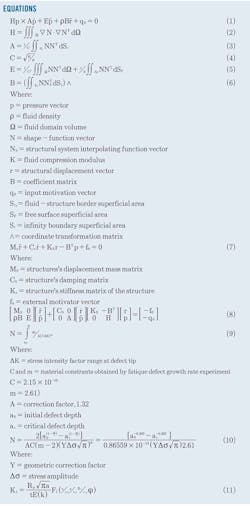
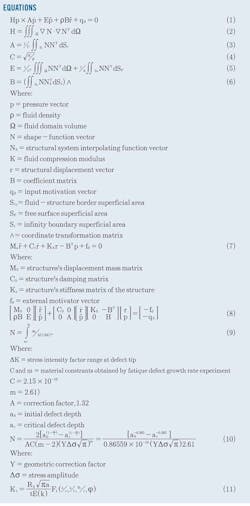
The finite-element analysis frequently applied in the FSI system is a variable of the structure and fluid field in the displacement form of the displacement vector. Determination of FSI uses fluid displacement and structure displacement.8-11 Equations 1-6 in the accompanying box determine the fluid motion equation.
The motion equation of the structure in contact with the fluid can be derived by using the finite-element method (Equation 7). Combining the two formulas yields the motion equation of the fluid–structure system, composed of the structure and surrounding fluid. The transient response of the structure can be calculated with the time-domain method. Equations 1 and 7 combine to form Equation 8.
Defect propagation
The stress distribution of the semi-ellipse defect in the pipe derived by the FSI method says the Paris formula can calculate residual fatigue frequency (Equation 9). Introducing the linear elastic fracture criterion to Equation 9 yields Equation 10.
Finite-element FSI
The natural gas pipeline model was chosen from a section of the West-to-East Natural Gas Transmission project. The pipe had a 1,016-mm OD, 19.7-mm WT, and 10-MPa design pressure. Methane simulated the gas medium. Table 1 shows the mechanical properties of the X70-grade steel pipeline.12
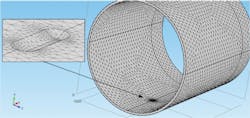
The main pressure in the high-strength steel pipe is the delivery pressure of the fluid medium, applied radially to the inner wall. The internal pressure therefore has a destructive effect and significant tear strength on the pipe's axial defects.13 Technicians established a straight, high-strength steel pipe model with a semi-ellipse defect 5 mm long, 6 mm wide, and 3 mm deep. Fig. 1 shows the unstructured grid partition model.
The inner space of the pipe is the fluid region and the pipe the solid region. The left and right sides of the pipe served as the computational domain inlet, with pressure-inlet condition, and outlet, with a pressure-outlet condition, respectively. The wall along the pipe remaining in contact with the fluid provided the non-slipping wall condition and could be solved by using a staggered method.
The fluid field in the pipe provided simulated fluid parameters. Fig. 2 shows flow velocity. Average gas velocity in the pipe remained at about 23 m/sec (Fig. 2) because of the change of the flow channel around the semi-elliptical defect. The average flow velocity of the gas gradually decreased at the defect tip, with gas-flow velocity reaching a minimum value of 2 m/sec at the inlet and outlet of the defect. After gas flowed through the defect, its velocity gradually increased to average.
The turbulent kinetic energy in the pipe (Fig. 3) gradually decreases as the gas enters the pipeline. When the gas flows through the defect, the turbulent kinetic energy gradually increases, reaching a 140-sq m/sec2 maximum at the defect outlet.
Stress distribution at the inner pipe wall remained at about 100 MPa, while stress at the contact area between the inner wall and the flow field could be as high as 150 MPa. The flow field affects the stress distribution at the inner wall of the high-strength steel pipe. For the concentrated stress of the defect, the von Mises stress reached a minimum value of 80 MPa on both sides of the semi-elliptical defect. At the defect tip, the von Mises stress increased to 430 MPa, close to the yield strength of the steel (Fig. 4).
Distributing the cross-sectional stress of the defect decreases the concentrated stress along the direction of the bottom of the defect. On the narrow flow path in the defect, changes in concentrated stress advanced by the flow are not obvious when reducing gas velocity. The distribution of the turbulent kinetic energy at the defect tip does not increase significantly. Given the fixed boundary in the right side of the pipeline, an annular stress-reduction belt forms at the outlet.
Field examination of stress in the gas transmission pipeline in 2011 used a PSF-2M x-ray stress analyzer (Fig. 5) through a 2θ~sin2Ψ approach. Bearing stress-distribution features in mind, examination avoided weld joints and focused on the relatively smooth section of the pipeline. Longitudinal stress distribution examinations occurred every 200 mm.
Polishing the examined portion before beginning this process removed rusty scales and surface dirt. This portion was polished again with a fine sandpaper to achieve a smooth and clean surface. Finally, electrochemically polishing the examination site removed surface machining stress caused by polishing. Electrochemical polishing depth measured 100 μm. Results were consistent with the stress distribution of the inner wall under influence of the flow field in the simulation (Table 2).
Residual fatigue life
Engineers applied the stress distribution of high-strength steel pipe calculated by FSI to analyze and compare residual fatigue life with the residual fatigue life calculated under a simple internal pressure load.
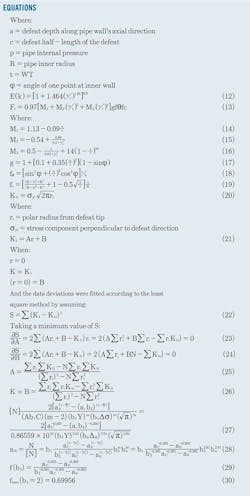
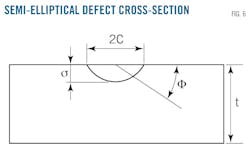
Loop stress is the primary influence on residual fatigue life under a simple internal pressure load. Referring to the manual of stress intensity factors, Equations 11-19 calculate stress intensity factor K1 of the semi-ellipse defect under internal pressure, p (Fig. 6).14
The stress intensity factor at the deepest point of the semi-ellipse defect is 382.223 MPa mm under a simple pressure load. Ignoring small-range pressure fluctuations and considering only pipeline shutdown cases yields ∆p=10 MPa. When a0 = 3 mm and ac = 9.85 mm in the 50% WT, Equation 10 can calculate residual fatigue life of the high-strength steel pipe as N = 36,973.
The FSI method guided selection of stress data at the defect tip. Stress singularity prompted use of the least square method to fit K1i , corresponding to the non-singular stress at each position of ri>0 (Equation 20). An assumed linear relationship linked ri and K1i (Equations 21-22).
Taking a minimum value of S, Equations 23-24 yield Slope A and Intercept B of the fitted straight line (Equations 25-26).
Considering the flow field allows calculating the stress intensity factor at the deepest point of the semi-ellipse defect as 432.393 MPa mm(Equation 26). Adopting conditions of Section 4.1—namely, ∆p = 10 MPa, a0 = 3 mm, and ac = 9.85 mm—and applying Equation 10 calculates the residual fatigue life of the high-strength steel pipe as N = 26,724, or 72.27%, as long as a simple pressure load is applied.
Safety factor
Safety factors influencing residual fatigue life of high-strength pipelines in site conditions include four components.
• Correction of the statistical deviations of the material data. For fatigue defect growth rates, material constants C counted by the average regression should be corrected by the material properties. The recommended coefficient is b1 = 4.15
• Correction of critical defect depth. Given the dangers of the incidents caused by pipeline damage, the coefficient b2 is used to reduce the risk of misgauging critical defect depth (b2 = 2 to 10).16
• Correction of the morphology of the semi-ellipse defect in the simulation. The coefficient b3 = 1.3 is recommended for the difference between the idealized defect properties in the finite-element calculations and the on site defect properties (mesh density in the defect tip, deviations in turbulence calculation, etc.).17
• Correction of stress variations (pressure fluctuation, erosion, and concentrated stress under stress corrosion). This article ignores small-range pressure fluctuations, instead considering only pressure fluctuations which result in a shutdown, b4 = 1.
Equation 27 calculates allowable life, [N], considering total impact of the safety factor in residual fatigue life. Equation 28 yields the safety factor in residual fatigue life. Assuming Equation 29 when using Equation 30 for the high-strength X70 steel pipe, when b2∈(2 to 10), and applying the results to Equation 28, generates a safety factor of 5.525 for calculating the pipe's residual fatigue life.
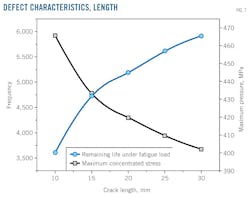
Engineers analyzed maximum stress and stress intensity factors for different axial lengths (10, 15, 20, 25, and 30 mm) of semi-elliptical defects (Fig. 7). Maximum concentrated stress gradually increases with increasing defect length. Linear growth approximates the actual growth trend. Maximum concentrated stress in the 30-mm defect is 16.28% larger than maximum concentrated stress in the 10-mm defect, reaching 465.31 MPa.
The stress-intensity factor increases with increasing maximum stress in the defect, leading to decreased residual fatigue life of the high-strength steel pipe. When axial defect length increases to 30 mm from 10 mm, the pipe's residual fatigue life decreases to 3,672 from 5,916 by safety factor correction, thus reducing fatigue life to 60% of original fatigue life.
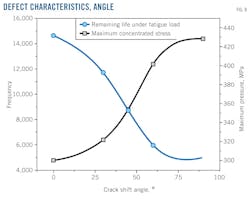
The maximum concentrated stress gradually decreases when the semi-elliptical defect in the axial direction (i.e., 15-mm length) is deflected from an axial direction to a radial direction at the bottom surface of the pipe. A sinusoidal curve can describe this trend (Fig. 8). Maximum stress can reach a minimum 302.92 MPa at the radial defect, causing residual fatigue life to increase to 14,369 from 4,776. Maximum stress decreases to 70.12% of original stress, and residual fatigue life is 300.85% of original life.
Acknowledgement
The project is supported by the National High Technology Research and Development Program of China, Grant No. 2012AA040105.
References
1. Fairchild, D.P., Sisak, W.J., Petersen, C.W., Papka, S.D., Macia, M.L., Corbett, K.T., Appleby, R.J.T., Koo, J.Y., Bangaru, N.V., Weir, M.S., and Zhang, F., "Research on Grade X120 Steel Pipes for Long-Distance Gas Transmission Pipeline," Welded Pipe and Tube, Vol. 29, No. 3, pp. 27-32, March 2006.
2. Shiozawa, K., Morii, Y., Nishino, S., and Lu, L., "Subsurface Crack Initiation and Propagation Mechanism in High-Strength Steel in a Very High-Cycle Fatigue Regime," International Journal of Fatigue, Vol. 28, No. 11, November 2006.
3. Shiozawa, K., and Lu. L., "Internal Fatigue Failure Mechanism of High-Strength Steels in Gigacycle Regime," Key Engineering Materials, Vol. 378-379, No. 15, pp. 65-80, March 2008.
5. Lukas, J., "Fatigue Crack Growth Test on Type 321 Austenitic Stainless Steel in Corrosive Environment and at Elevated Temperature," Procedia Engineering, Vol. 2 (2010), No. 25, pp. 1201-1210.
6. Toyoda, S., Kimura, H., Kawabata, Y., Hashimoto, S., Yoshihara, N., and Sakai, J., "Numerical Simulation of Fatigue Crack Initiation in Thin-Walled High Strength Steel as Modeled by Voronoi-Polygons," Iron and Steel Institute of Japan International Journal, Vol. 50, No. 11, pp. 1695-1701, Nov. 15, 2010.
7. Islam, M.A., and Farhat, Z.N., "Erosion-Enhanced Corrosion and Corrosion-Enhanced Erosion of API X-70 Pipeline Steel, Wear, Vol. 302, Issues 1-2, pp. 1592-1601, April-May 2013.
8. Cheng, G.D., Cai, Y., Zang, H.B., Liu, G., and Wang, J.Y., "Analysis and Optimization for Fluid-Solid Coupling Performance of ADINA-based Shuttle Type Check Valve," Machinery Design & Manufacture, Vol. 5, No. 5, May 2012.
9. Zhang, A.M. and Dai, S.S., "Fluid-structure Interaction Dynamics," Beijing: National Defense Industry Press, 2011.
10. Pope, S.B., "Turbulent Flows," Beijing: World Publishing Corp., 2010.
11. Yang C. and Yi M.L., "Numerical Solution of Fluid-structure Interaction in Liquid-filled Pipes by Method of Characteristics," Chinese Journal of Mechanical Engineering, Vol. 20, No. 3, pp. 44-49, March 2007.
12. American Petroleum Institute, "Specification for Line Pipe—API 5L," 2007.
13. Mattheck, C., Munz, D., and Stamm, H., "Stress Intensity Factor for Semi-elliptical Surface Cracks Loaded by Stress Gradients," Engineering Fracture Mechanics, Vol. 18, No. 3, pp. 633-641, March 1983.
14. Newman, Jr., J.C., and Raju, I.S., "Stress-intensity Factors for Internal Surface Cracks in Cylindrical Pressure Vessels," Journal of Pressure Vessel Technology, Vol. 102, No. 4, pp. 342-345, April 1980.
15. Gupta, P., Pereira, J.P., Kim, D.J., Duarte, C.A., and Eason, T., "Analysis of Three-dimensional Fracture Mechanics Problems: A Non-intrusive Approach Using a Generalized Finite-element Method," Engineering Fracture Mechanics. Vol. 90, pp. 41-64, August 2012.
16. Xu, T.L., Yao, A.L., Zeng, X.G., and Li Y., "Study on the Security Conditions of Parallel-laying Gas Transmission Pipelines Under Blast Loading," International Conference on Pipelines and Trenchless Technology, Beijing, Oct. 26-29, 2011.
17. Van Wittenberghe, J., DeBaets, P., De Waele, W., and Van Autreve, S., "Numerical and Experimental Study of the Fatigue of Threaded Pipe Couplings," WIT Transactions on Engineering Sciences, Vol. 62, pp. 163-174, 2009.
The authors
Yue Cui ([email protected]) is a PhD candidate in engineering at Beijing Jiaotong University, Beijing. He holds an MS (2012) from Beijing Jiaotong University.
Hui-qing Lan ([email protected]) is an associate professor at Beijing Jiaotong University. She also completed postdoctoral work at the University of Tokyo. Lan holds a PhD in engineering (2002) from China University of Petroleum, Beijing, and is a member of the Petroleum Storage & Transportation Committee of China Petroleum Society.
Ren-yang He ([email protected]) is a senior researcher at China Special Equipment Inspection and Research Institute, Beijing. He holds a PhD in engineering (2001) from China University of Petroleum, Beijing, and is a member of Chinese Society of Corrosion and Protection.
Chao-hui Zhang ([email protected]) is a professor at Beijing Jiaotong University. He holds a PhD in engineering (2002) from Tsinghua University. Zhang is a member of the World Association of Science Engineering and an editor member of the International Journal of Current Engineering and Technology.
