Earnings, revenues down for OGJ150 in 2013; liquids output, reserves up
Conglin Xu
Senior Editor-Economics
Laura Bell
Statistics Editor
The combined earnings of the OGJ150 group declined 3.03% during 2013 to $88.1 billion. The group's revenues for the year were also down 7.32% from a year earlier to $944.9 billion. Nevertheless, compared with a year ago the number of companies making a profit climbed in 2013.
Increased expenses, weaker downstream margins, lower Brent prices, and production disruptions at some international operations contributed to the reduced collective earnings. Impairment charges, asset sales, and litigation losses of some companies also deflated the numbers.
The OGJ group's US and worldwide liquids production and reserves continued to grow strongly in 2013, driven by improved drilling technology as well as vast capital investment. Total assets and stockholders' equity of the group increased nearly 8% for the year largely because of a boost in capital expenditures that occurred in 2012.
Meanwhile, firms' investment attitudes turned more cautious in 2013, as indicated by slower drilling activity and stagnate capital spending growth.
The group's combined natural gas reserves increased strongly in 2013 but production growth was slight. Natural gas prices in the US have risen somewhat in 2013, but remain well below average.
To qualify for the OGJ150, oil and gas producers must be headquartered in the US, publicly traded, and hold oil or gas reserves in the US. There are 147 companies in this edition of the OGJ150. Last year's group contained 145 firms (OGJ, Sept. 2, 2013, p. 34).
As always, data for this year's list reflect the prior year's operations.
Market snapshot for 2013
The average price of Brent crude in 2013 declined for the first time since 2009 but remained near record levels. Brent spot prices averaged $108.56/bbl in 2013, a decline of $3.07/bbl and $2.70/bbl, respectively, from its 2012 and 2011 levels.
WTI crude spot prices averaged $97.98/bbl in 2013 compared with $94.05/bbl in 2012 and $94.88/bbl in 2011. The spread between Brent and WTI narrowed but remained elevated. Since 2011, the WTI discount to Brent has averaged $14.84/bbl compared with an average premium of $1.39/bbl for the preceding decade.
According to the International Energy Agency's 2014 Annual Statistical Supplement, oil consumption worldwide increased by 1 million b/d in 2013, or 1.1%, averaging 91.6 million b/d for the year. Countries outside the Organization for Economic Cooperation and Development accounted for nearly all the net growth.
OECD oil demand stagnation continued in 2013, due to consumption declines in OECD Europe and Japan. However, the US recorded the largest increment of 400,000 b/d to global oil consumption in 2013, outpacing Chinese growth for the first time since 1999.
With a 1.2 million b/d increase in 2013, the US delivered the world's largest increase in oil production. Crude output from the Organization of the Petroleum Exporting Countries declined 2.5% to 30.5 million b/d from a year earlier.
The average US refiner acquisition cost of composite crude oil fell in 2013 to $100.49/bbl from $100.93/bbl a year earlier. Meanwhile, cash margins in most refining centers decreased in 2013 from a year ago, according to data from Muse, Stancil & Co.
In 2013, gas prices rose in North America for the first time since 2010, with Henry Hub prices averaging $3.73/MMbtu.
Changes to the group
Thirteen companies appear in the OGJ150 for the first time. The highest-ranking for these, Oasis Petroleum Inc., based in Houston, sits at No. 33 based on yearend 2013 assets. The company acquired certain assets in the Williston basin last year totaling 161,000 net acres and costing $1.5 billion (OGJ Online, Sept. 5, 2013).
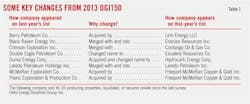
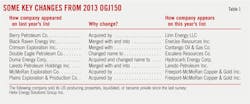
Nine companies listed last year do not appear in the current group as a result of mergers, acquisitions, name changes, or asset sales.
Freeport-McMoRan Copper & Gold Inc. (currently Freeport-McMoRan Inc.) acquired Plains Exploration & Production Co. and McMoRan Exploration Co. last year. Berry Petroleum Co. was acquired by Linn Energy LLC. Duma Energy acquired Hydrocarb Co., and later changed its name to Hydrocarb Energy Co. Double Eagle Petroleum Co., based in Denver, announced a name change to Escalera Resources Co.
Crimson Exploration Inc. was merged with Contango Oil & Gas Co., and Black Raven Energy Inc. was merged with EnerJex Resources Inc. Laredo Petroleum Holdings Inc. is now listed as Laredo Petroleum Inc.
Helix Energy Solutions Group, previously included in the OGJ150, no longer appear because the company sold its oil and gas subsidiary to Talos Energy LLC, a privately held Houston-based firm.
Nine companies on this year's list are publicly traded limited partnerships (LPs), compared with 8 on the 2012 list. The largest LP this year is Kinder Morgan CO2 Co. LP, with assets of $4.7 billion. The smallest LP on the list, Apache Offshore Investment Partners, had assets of $12.7 million.
There are 5 royalty trusts listed this year, the same as the year before. There are 6 companies that are subsidiaries of non-US energy companies or of companies operating mainly in another industry.
Financial performance, operations
In 2013, 85 companies in the OGJ150 posted a profit compared with 71 companies in 2012 and 94 companies in 2011. There were 38 companies posting net income of more than $100 million in 2013, 28 in 2012, and 45 in 2011.
A total of 54 companies posted net losses in 2013. Twelve of them had losses exceeding $100 million compared with 24 in 2012 and 7 in 2011.
Ranked No. 31 by assets, Halcon Resources Co. posted the largest net loss of $1.22 billion among the OGJ150 group in 2013, as a result of noncash impairment charges. Certain items typically excluded by the investment community, including a Tronox-related loss accrual, decreased Anadarko Petroleum's 2013 earnings by about $2 billion.
Return on assets for the OGJ150 group fell to 6.1% in 2013 from 6.8% in 2012, while return on revenue moved up to 9.3% from 8.9% in 2012.
The group's total US net wells drilled in 2013 declined almost 4% to 17,247.9 from a year earlier. The combined capital and exploration expenditures were nearly flat with the previous year's level. This compares with a 17.14% increase in expenditures recorded in 2012.
In 2013, OGJ150 worldwide liquids production increased 6.05% in 2013 to 3 billion bbl. US liquids production by the group was up dramatically by 17.35% to 1.65 billion bbl. By yearend 2013, group worldwide liquids reserves increased 9.9% to 39.95 billion bbl. US liquids reserves for the group increased 14.12% to 22.5 billion bbl.
The combined worldwide gas production of the group decreased slightly 0.26% to 16.89 tcf in 2013. In the US, these companies produced 11.79 tcf, a 2.2% increase from a year earlier.
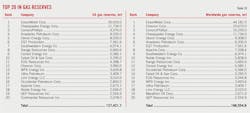
Group gas reserves in the US increased 9.81% to 158 tcf in 2013, following a decrease of 8.64% a year earlier. On a worldwide basis, the group booked more modest reserves increase of 6% for gas to 221 tcf, after a drop of 7.61% seen in 2012.
Top 20 companies by assets
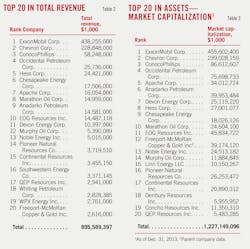
This year's list includes three newcomers to the top 20 positions in the assets ranking. Concho Resources Inc., No. 22 last year, swapped places with WPX Energy Inc. and is situated at No. 19. QEP Resources Inc., which was ranked at No. 21 previously, is now No. 20. Freeport-McMoRan's acquisitions of Plains E&P and McMoRan Exploration Co. propelled the company to No. 12.
As usual, ExxonMobil Corp. holds the top spot, reporting $346.8 billion in assets at yearend 2013, up 4% from the previous year. It is followed by Chevron Corp., ConocoPhillips, Occidental Petroleum Corp., and Apache Corp.
The top 20 companies had total assets of $1,233 billion at yearend 2013, representing 86.6% of the entire group's assets. This compares with $1,150 billion for the top 20 a year ago and $1,128 billion the year before that.
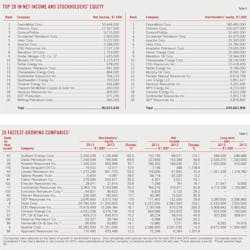
The top 20 received revenues of $893.79 billion in 2013, down from $975.94 billion in 2012 and $994.68 billion in 2011. Collectively, these firms posted 2013 net income of $86 billion, down from $98.33 billion in 2012 and $106.4 billion in 2011. The revenues and net income for the top 20 were 94.6% and 97.7%, respectively, of the group total.
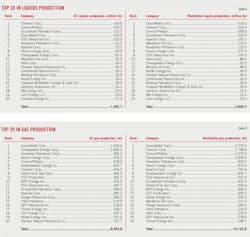
The top 20 companies produced 15.23% more liquids in the US last year, totaling 1.28 billion bbl. Their liquids production worldwide increased 3.93% to reach 2.64 billion bbl. Gas production, meanwhile, declined 1.91% in the US and 3.48% worldwide year-over-year.
The top 20 group's liquids reserves climbed 11.64% in the US and 8.16% worldwide, respectively. Their natural gas reserves in 2013 also increased both in the US and worldwide, by 4.01% and 1.32%.
Capital and exploratory expenditures in 2013 by the top 20 totaled $166.6 billion, up from $164.5 billion in 2012 and $140.5 billion in 2011. Expenditures of the top 20 amounted to 80.7% of the OGJ150 total last year.
The top 20 companies drilled 10,957 net wells last year, down from 11,492 net wells drilled in 2012 and accounting for 63.5% of wells drilled by the whole OGJ150 group.
Earning leaders
ExxonMobil tops the list by 2013 earnings, posting net income of $33.45 billion. Compared with 2012, however, the company's earnings declined almost 30%, largely due to lower liquids realizations; lower net gains from asset sales, mainly in Angola; higher expenses; and weaker downstream margins.
Chevron is the second among the earnings leaders with $21.59 billion in 2013 net income, followed by ConocoPhillips, Oxy, and Hess Corp.
EOG Resources Inc. posted earnings of $2.19 billion last year vs. $570 million a year earlier, primarily driven by a 40% increase year-over-year in crude oil and condensate production.
Four companies qualified for the list of the top 20 earners that did not qualify a year ago. Chesapeake Energy Corp. and Southwestern Energy Co. both recovered from net losses of 2012, posting respective earnings of $894 million and $703.5 million for 2013. EQT Production reported a 97.5% climb in earnings from a year ago to $371 million. Freeport-McMoRan Copper & Gold ranks No. 17 after acquisitions.
Top 20 in capital spending, drilling
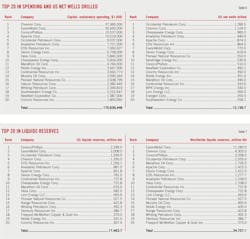
With $37.98 billion in outlays in 2013, Chevron overtakes ExxonMobil and leads the OGJ150 group in capital expenditures for this year. ExxonMobil is the second, with $35.64 billion in expenditures, followed by ConocoPhillips, Apache, and Oxy.
Halcon Resources Co. and Newfield Exploration Co., both not on the top 20 list a year ago, recorded the sixteenth and nineteenth highest capital expenditures in 2013. Their outlays totaled $2.38 billion and $1.99 billion, respectively. The two companies replace Sandridge Energy Inc. and Plains E&P from last year's top 20 list.
The collective outlays of the top 20 capital spending leaders totaled $170.3 billion compared with the previous top 20's spending of $169.2 billion in 2012. Capital and exploratory expenditures by the top 20 totaled $145.5 billion in 2011 and $117.5 billion in 2010.
The top 20 companies reported drilling a total of 12,138.7 net wells in the US for 2013, down from 13,573 wells in 2012 and 13,871 wells in 2011, in response to low natural gas prices, high drilling costs, and the industry's more cautious attitudes.
With a count of 1,289.5 wells, Oxy led the group in the number of net wells drilled in the US during 2013. The company also led the group for its number of wells drilled in the US during 2012, with a count of 1,411.
Chevron drilled 1,124 wells in the US in 2013 compared with 951 a year earlier and is the second company on the current list. Chesapeake Energy Corp. drilled 985 wells in the US last year, ranked at No. 3 and down from 1,272 wells drilled in 2012.
Sandridge reported 530.9 wells drilled in 2013, down from 957.9 wells in 2012, corresponding to the company's decrease of $2.1 billion in spending last year. ExxonMobil's net wells drilled in US declined to 770 in 2013 from 1,163 in 2012.
Production, reserves leaders
ExxonMobil, Chevron, and ConocoPhillips are the top three companies of the OGJ150 group this year in worldwide liquids production and reserves, as well as in worldwide natural gas production and reserves. The rankings are unchanged from a year ago.
Oxy is ranked fourth in terms of worldwide liquids production and reserves. Fourth in worldwide gas production and reserves is Chesapeake.
With 164 million bbl of output, Chevron produced the most liquids in the US during 2013, followed by ConocoPhillips, Oxy, and ExxonMobil.
ConocoPhillips's liquids reserves in the US recorded an increase of 8% in 2013 to 2.3 billion bbl, topping the group again and followed by ExxonMobil, Oxy, and Chevron.
The company with the most US gas production in 2013 is ExxonMobil, followed by Chesapeake, Anadarko Petroleum Co., Devon Energy Corp., and ConocoPhillips. ExxonMobil also leads the group in US gas reserves, followed by Chesapeake, ConocoPhillips, and Anadarko. Notably, since its acquisition of XTO Energy Inc. in 2011, ExxonMobil has been topping each list of the leaders in the US and worldwide gas production and reserves.
Fast-growing companies
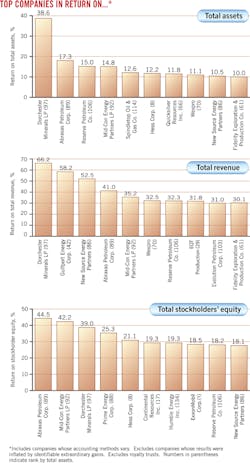
The ranking for the OGJ150 list of the fastest growing companies is based on growth in stockholders' equity. Other qualifications are that companies are required to have positive net income for 2013 and 2012 and have an increase in net income in 2013. Subsidiary companies, newly public companies, and LPs are not included.
Oklahoma City independent Gulfport Energy Co. is the fastest growing company among the OGJ150 firms during 2013. Its stockholders equity moved up 82%, and net income increased 124.1% in 2013. The company ranked No. 42 in the group by assets. With successful developments in the Utica shale of eastern Ohio and along the Louisiana Gulf Coast, the company ended 2013 with record production of nearly 28,000 boe/d, representing a 300% growth over their 2012 exit rate.
Oasis Petroleum, the second fastest grower on the list and No. 33 in total assets, posted increases in stockholders' equity of 69.6% and net income of 48.6%. Its long-term debt also doubled in 2013.
The highest-ranking company by assets on the list of fast growers is Apache, which reported an increase in stockholder equity of 13% and an increase in net income of 14.3% last year.
Three of the current fast growers were also on the list in the previous edition of the OGJ150. These are Rosetta Resources, Hess, and EPL Oil & Gas Inc.
