Beginning with the February Short-Term Energy Outlook, the US Energy Information Administration incorporated significant upward revisions to historical liquid fuel consumption from 2013-14, with the largest changes occurring in China and other nonmembers of the Organization for Economic Cooperation and Development. These revisions create a higher baseline from which 2015–16 STEO consumption is estimated.
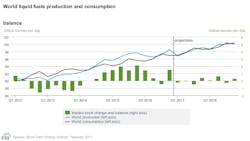
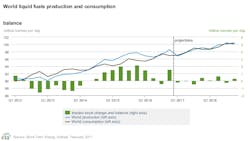
“With higher consumption only partially offset by additional production, the implied inventory builds—total global supply minus total global consumption—for 2015 and 2016 are smaller than previously forecast,” EIA said.
In the February STEO, EIA now estimates that global liquid fuels inventories rose by an average of 1.8 million b/d in 2015 and by 800,000 b/d in 2016. Those estimates are a respective 200,000 b/d and 100,000 b/d lower than in the January STEO.
As a main effect of this change, EIA now expects the global oil market to be largely in balance in 2017 and 2018 with implied global inventories forecast to draw by 100,000 b/d and build by 200,000 b/d in those years, respectively. Previously, EIA had forecast small annual average builds in both 2017 and 2018.
Demand
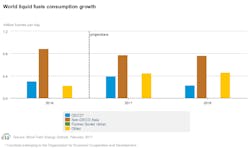
In the February STEO, global liquid fuels consumption is expected to average 98.09 million b/d in 2017 and 99.55 million b/d in 2018 compared with 97.2 million b/d and 98.71 million b/d, respectively, forecast in the January STEO. Although the consumption baseline is elevated, consumption growth, namely 1.6 million b/d in 2017 and 1.5 million b/d in 2016, are unchanged from last month’s STEO.
“Many economic and financial data series point to improved future economic growth for both developed and emerging market economies, which supports the oil consumption growth outlook,” EIA said.
The composite leading indicator, a measure of economic growth, for OECD countries as a group has been rising since June 2016, implying that economic activity for those countries collectively could strengthen in the near term. The composite leading indicators for emerging markets, with the exception of India, have been rising since late 2015 and early 2016. The leading indicators for Brazil and Russia are above 100, potentially signaling that economic activity could be above their long-term average this year as their economies begin to recover from recessions.
Crude oil supply
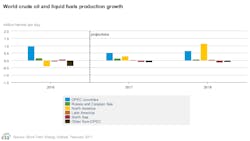
In this month’s STEO, EIA expected supply from the Organization of Petroleum Exporting Countries to increase by 200,000 b/d in 2017 and by 500,000 b/d in 2018. Recent estimates of production from Libya, which is not subject to any production target under the OPEC curtailment agreement, average almost 700,000 b/d in January, the country’s highest production level since 2014.
Saudi Arabia recently announced it is meeting its production target, and the country is estimated to have produced slightly less than 10 million b/d in January.
US crude oil production is expected to increase by 100,000 b/d, averaging 9 million b/d in 2017 year-over-year and by 500,000 b/d in 2018. The US oil-directed rig count increased by 41 rigs in January, the eighth consecutive monthly increase and the first year-over-year increase since December 2014, according to Baker Hughes Inc.


