Texas pipelines to have $374-billion economic impact through 2024
Bradley T. Ewing
Marshall Watson
Texas Tech University
Lubbock
Between the current year and 2024 the Texas pipeline industry will generate cumulative economic impacts (in today's dollars) of around $374 billion in economic output, $212 billion in additional gross state product, and contribute $19.5 billion to state and local government revenues. The industry will also sustain around 171,000 jobs/year Texas. Total effects in 2013 alone from construction and operation of pipelines in Texas included 165,000 jobs, $33.1 billion in output, and $18.7 billion in value added.
This article's findings are based on a comprehensive study the authors published in July titled "Current and Future Economic Impacts of the Texas Oil and Gas Pipeline Industry." The Texas Pipeline Association (TPA) funded the research. The full study is available on the TPA website, www.texaspipelines.com.
Recent innovations and discoveries in both plays and technologies have given rise to increased production of oil and gas and have led to additional demands on the pipeline system. Provided that the pipeline industry maintains effective transportation capabilities, it will continue to generate economic benefits that will impact Texas for years to come. The upstream and downstream portions of the energy industry (i.e., exploration and production, and refining) will also generate even more economic benefits to Texas provided they have efficient and effective means of transportation.
Effect mechanisms
The pipeline industry's economic impact stems from the transportation of hydrocarbons from production sources to refineries and end-users. This activity, in turn, leads to a number of secondary but critical supply chain activities, including building pipelines, processing plants, meter stations, compressors, and fractionators, and manufacturing equipment. Secondary effects of the pipeline industry include the continuing operation and expansion of suppliers to the industry, as well as growth in the wholesale, retail, real estate and housing, and financial services sectors derived from the increased dollars generated.
In addition to discussing these effects this article includes petroleum engineering and geophysical factors analysis in characterizing the pipeline industry's impact on Texas. Well productivity has improved dramatically since 2011 due to improved technology in horizontal drilling and multi-stage hydraulic fracturing. These factors have led to current high production levels and contributed many economic benefits to the state.
The article also estimates pipeline economic impact for the year ending 2013 and provides projections for 2024. Given the sharp decline in oil prices beginning in the middle of 2014, it also provides insights as to how and to what extent these economic effects might have changed.
Objectives, methodology
The research methodology used in this study combines elements of energy economics and petroleum engineering. In order to fully capture the underlying factors of economic activity in Texas, we analyzed historical economic and petroleum engineering data. The engineering assessment takes historical activity and production, builds a model to project 10 years forward, and then compares expected production with pipeline takeaway capacities. Pipeline takeaway capacities were based on surveys conducted by TPA and studies of oil pipelines published for the Permian and Texas Gulf Coast basins.
Not all entities completed the TPA surveys, resulting in a figure that is less than 100% of actual takeaway capacity. The total capacities summed for each basin from the surveys, however, still represent its relative takeaway. Production profiles were projected as a function of both drilling activity and knowledge of the type of play or formation being drilled.
The five major Texas basins studied were:
• Anadarko-Granite Wash and Cleveland formations.
• East Texas-Cotton Valley, Haynesville, and Bossier.
• Permian-Cline, Spraberry, Wolfberry, Wolfcamp, Bone Spring, and Avalon.
• Texas Gulf Coast-Eagle Ford.
• Fort Worth-Barnett.
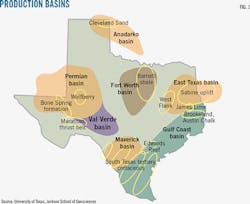
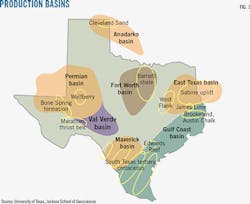
These basins were selected on the basis of having the most drilling, development, and production activity. Each basin's production, rig activity, and pipeline takeaway capacity were assessed. While we conducted analysis both for each basin and for Texas as a whole, only the Texas total is reported here. Fig. 1 shows basin locations.
Several of these plays are or may potentially be a resource play as defined by Society of Petroleum Evaluation Engineers (SPEE) parameters set forth in "Monograph 3; Guidelines for Practical Evaluation of Underdeveloped Reserves in Resource Plays (2010)." Resource plays are also sometimes called unconventional plays or reservoirs. Resource plays are important to this article because they result in long-term sustained activity.
In assessing these basins and Texas in total, we made 10-year conservative projections for three different scenarios for hydrocarbon production and rig count. These scenarios are:
• High forecast: Anticipating stable oil prices of more than $100/bbl and increasing natural gas prices resulting in continued or increased drilling.
• Moderate forecast: Anticipating oil prices of $70-$90/bbl with some instability and gas prices near $4/MMbtu.
• Low forecast: A collapse in oil and gas prices resulting in minimal activity.
In the high forecast, we did not include an $8-10/MMbtu gas price's influence on drilling and production in the dry gas areas of the Eagle Ford, Haynesville, and Barnett. Eagle Ford and Haynesville drilling at these prices could be several orders of magnitude more than what we projected in the high forecast. Data limitations, however, prevent an assessment of the associated drilling and production impacts at this time.
Engineering analysis
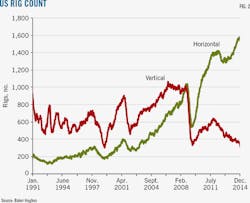
A total of 835 rigs operated in Texas as of Dec. 27, 2013, representing 48% of total rigs running in the US and 25% of the total world rig count, according to Baker Hughes data. By the end of December 2014, Texas had 872 rigs running, accounting for nearly 47% of total rigs running in the US and 34% of the total world rig count. Advancement in hydraulic fracturing and horizontal drilling technologies also allowed an increasing percentage of the wells in the US to be drilled horizontally (Fig. 2).
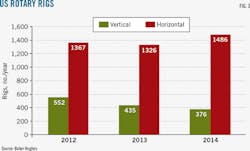
The effect of the US economic recession on the oil and gas industry can clearly be seen in 2008. Since then, most of the rigs in the US are drilling directional-horizontally vs. vertically. Fig. 3 shows that in 2012-14, the number of horizontal and directional rotary rigs increased by 119 (9%) and the number drilling vertically decreased by 176 (32%).
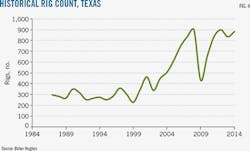
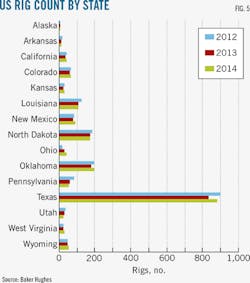
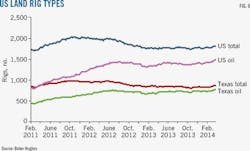
The historical trend in the Texas rig count (Fig. 4) closely mirrors that of the US rig count. Texas has the most rigs in operation (Fig. 5) and the most drilling activity in the US. Fig. 6 shows the closing gap between total rig count and rigs drilling for oil, reflecting operators' preference for hydrocarbon liquid, especially after 2008.
Texas total
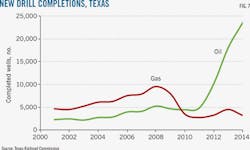
An increasing number of wells were completed in Texas following the 2008 recession, with more than 22,000 total completions in 2013 and nearly 27,000 total completions in 2014. Of these completions, more than 18,000 were oil wells in 2013 and nearly 24,000 were oil wells in 2014. Fig. 7 shows a dramatic drop in the number of wells completed during the recession. Oil well completions, however, quickly recovered and had surpassed pre-2008 levels by 2011.
Natural gas prices never recovered after 2008, while oil prices quickly returned to pre-2008 levels and continued to increase. Oil and gas companies in Texas refocused capital budgets to liquids-prone basins. The two areas that benefited the most were the Permian basin and the Eagle Ford (Texas Gulf Coast basin), which more than compensated for the Barnett and Haynesville's sustained drop in rig count and drilling activity. Overall, increases in completions continued through 2014, although likely driven by the activity in the first half of the year before the oil price decline.
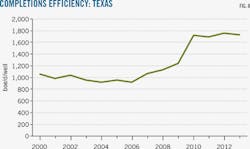
Of the five Texas basins examined, the Permian and Texas Gulf Coast continued to see increased horizontal drilling and sustained development through 2014, resulting in increased completion efficiencies as represented by growing production (Fig. 8). Improved horizontal drilling and hydraulic fracturing accounted for these efficiency gains.
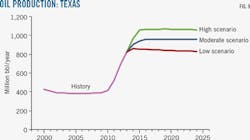
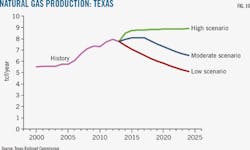
The Fort Worth (Barnett shale) and East Texas (Haynesville shale) basins are gas prone and have not experienced much growth in drilling. The northwest portion of the Eagle Ford is liquids prone, as is most all of the Permian basin, and will continue to see expanded drilling at oil prices of $80/bbl or more. Figs. 9 and 10 show oil and gas production forecasts through 2024.
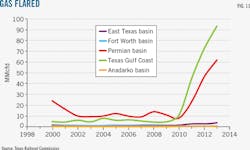
Operating effectively and efficiently requires sufficient takeaway capacity. Table 1 summarizes current production and takeaway capacity in Texas. More pipeline capacity may be needed to handle vented gas, which has increased exponentially since 2008.
Fig. 11 shows the amount of gas flared totaling 160 MMcfd in the five Texas basins, primarily from the Permian and Texas Gulf Coast basins where oil production from shale is prominent. Operators, in an effort to maximize cash flow, are flaring the gas and selling the oil. Associated gas flaring is mostly due to a lack of pipelines to gather and deliver the associated gas to a gas processing plant.
A substantial effort is under way in these basins to build gas pipelines and processing plants to move the gas to market. This article did not include the effect of an $8-10/MMbtu gas price, which would substantially increase drilling and production in the dry-gas areas of the Eagle Ford, Haynesville, and Barnett shales and necessitate more pipeline construction.
Economic impacts
The transportation of oil and gas in Texas entails several different specialized activities. These generate economic benefits by creating and sustaining jobs, income, value added, and output. In addition, the industry provides important state and local government revenues that benefit the citizens of the state.
A custom-built set of input-output (I-O) models measured the economic impact of the oil and gas pipeline industry on the Texas economy. The basis of an economic impact model is the spending patterns of individuals and businesses in the region.
Expenditures on supplies and equipment by firms engaged in operating and building oil and gas pipelines occur within the state and elsewhere, while oil and gas pipeline employees tend to spend most of their income more locally. Economists categorize the economic impacts from these expenditures into two types of effects: direct and secondary. Direct effects represent expenditures inside the region being studied. Direct effects lead to secondary effects in the form of business-to-business transactions in the region (e.g., to restore inventory), referred to as indirect effects, and also to new income in the form of wages and salaries, rent and interest payments, payments to proprietors and stockholders for investment, etc. (also known as induced effects).
This article refers to economic output (i.e., gross revenues) as the value of all industrial production (i.e., mining, services, retail trade, manufacturing, etc.) in Texas. It defines jobs as the average annual number of jobs in a sector, industry, or region, while labor income consists of all forms of employment income, including employee compensation (wages and benefits) and proprietor income. Value added shows additions to gross state product. All follow the convention used by the US Bureau of Labor Statistics (BLS) and Bureau of Economic Analysis (BEA).
The economic model identifies the economic links between businesses (or enterprises) and other businesses and between businesses and final consumers. From the model, we calculated a set of industrial sector economic multipliers unique to the Texas economy. These multipliers provide a comprehensive assessment of the economic impact of the oil and gas pipeline industry.
The economic impact analysis provides information about the number of jobs created and sustained by the pipeline industry's operation, income added to the state economy from its operations, which includes household income or earnings, and total output (in dollars) the industry contributes to the economy. Construction of new pipeline and related infrastructure (i.e., plants, meter stations) also has an economic impact. Unlike ongoing operations, however, construction impacts are shorter-lived, typically assumed to last 1 year. Given the current energy outlook, it is possible major construction projects will continue, providing economic benefits over several years.
The economic models reflect 2013, the last full year for which all data are available, and 2024. For the latter we considered three different scenarios corresponding to various economic environments.
To estimate the economic impact and contribution of the Texas oil and gas pipeline industry in 2013, we followed the convention of first estimating industry sales and using data internal to the model to identify all backward linkages in the study area related to the subject. Construction impacts were derived from estimates of construction expenditures for net new pipeline mileage using data from Oil & Gas Journal's annual Pipeline Economics reports for 2009-13. Pipeline mileage data (historical, current, and net new) came from the Texas Railroad Commission.
Analysis used IMPLAN Version 3.0 software, with 2012 values updated to reflect information obtained and estimated for 2013. The conversion to 2013 values was accomplished through a set of extrapolations (economic time series analysis) and validated with the engineering-related data. For purposes of this article, and following conventional economic-impact research, we defined the core sector as pipeline transportation or new nonresidential construction (pipeline other than sewer and water) where, for the latter, local purchase percentage is adjusted to reflect actual expenditure information obtained from the Texas Pipeline Association.
Estimating the 2024 projected impact of the Texas oil and gas pipeline industry required first computing the value of oil and gas produced and transported through the system. We used US Energy Information Administration (EIA) commodity price data for West Texas Intermediate crude oil ($/bbl) and Henry Hub natural gas ($/MMbtu) for this purpose. We assumed typical (average) gas sold in Texas is 1,100 btu/scf, with the corresponding conversion factor of 1.1, such that, for example, the 2013 price of $3.73/MMbtu corresponds to $4.103/Mcf. Oil valuation used the 2013 average price of $97.98/bbl.
For purposes of this analysis, we also followed the convention of holding technology constant over the projection horizon, which typically makes projections conservative. All future dollar figures were discounted to present value and production changes (i.e., changes in the amounts of oil and gas transported in the system) are in real terms. We assumed future construction to grow at the historically observed rate relative to industry sales.
Economic impact 2013
Table 2 summarizes the 2013 operations and construction-related impacts of the pipeline industry on the state of Texas. The pipeline industry resulted in 41,679 direct jobs and $15 billion of gross output. Total effects (i.e., direct, indirect, and induced) of operations and construction generated or sustained more than 165,000 jobs in Texas. Pipeline-related activities generated $33.1 billion in output, and contributed more than $18.7 billion in total gross state product.
When interpreting impact it is important to recognize that leakages occur in all economies; not all monies are spent entirely within the study area. Generally speaking, the larger the study area, the more able the model is to capture the spending and consequently reduce leakages. Standard economic-impact analysis follows the convention used by the BLS and BEA in which jobs are defined as the average annual number of jobs in a sector, industry, county, or region over a period of time such as a month or year. For example, a 40-hr/week job lasting 1 year is equivalent to two part-time jobs.
The Texas pipeline industry generates other economic benefits not measured in current jobs, income, value added, and output. The IMPLAN economic impact model provides estimates for taxes on production and imports, property, and various other taxes. In 2013, operations and construction by the Texas pipeline industry accounted for $1.6-billion in state and local government revenues.
Economic impact 2024
Projections of 2024 economic impacts use the underlying engineering analysis for the three different forecast scenarios (high, moderate and low) for hydrocarbon production and rig count and represent a range of economic environments. All future dollar figures are reported in today's dollars.
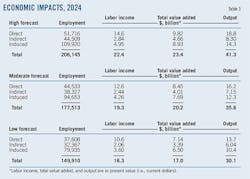
Table 3 summarizes the projected 2024 operations and construction-related impacts of the pipeline industry on Texas. In the high forecast, total pipeline projected impacts in 2024 will be more than 51,700 direct jobs and $18.8 billion of gross output. Pipeline operations and construction (i.e., direct, indirect, and induced) will generate or sustain more than 206,000 jobs in Texas. Pipeline-related activities will generate $41.3 billion in output and contribute more than $23.4 billion in total gross state product.
In the moderate forecast, total pipeline projected impacts in 2024 will be more than 44,500 direct jobs and $16.2 billion of gross output. Pipeline operations and construction (i.e., direct, indirect, and induced) will generate or sustain more than 177,500 jobs in Texas. Pipeline-related activities will generate $35.6 billion in output, and contribute more than $20.2 billion in total gross state product.
In the low forecast, total pipeline projected impacts in 2024 will be more than 37,600 direct jobs, $13.7 billion of gross output, and will generate or sustain more than 206,000 jobs in Texas. Pipeline-related activities will generate $30 billion in output, and contribute more than $17 billion in total gross state product.
The Texas pipeline industry also generates other economic benefits that are not measured in terms of current jobs, income, value added, and output. In 2024 the operations and construction activities of the Texas pipeline industry will account for state and local government revenues (in today's dollars) of $2-billion in the high forecast, $1.75 billion in the moderate forecast, and $1.47 billion in the low forecast scenario.
Oil price decline
The recent sharp decline in the price of crude oil to less than $50/bbl from more than $100/bbl raises concerns about whether these economic impacts will continue in the near future. While this study focused on estimating the economic impact of the Texas oil and gas pipeline industry in 2013, it is possible to provide some insights as to how the Texas economy has likely responded with respect to jobs, economic output, and additions to gross state product (i.e., value added).
Many of the measures of drilling activity, completions, and rig counts actually increased in 2014 from 2013 despite the price decline. It is, however, likely that had prices remained at 2013 or early-2014 levels, these increases in activity would have been substantially higher.
Total production and drilling activity increased in 2014 from 2013 and prices were high during the first half of the year and low in the second half. The resulting net effect for the pipeline industry would likely have been moderately higher use and activity, as hydrocarbons continued to be transported through existing infrastructure. Based on the 2013 impact results, therefore, and the engineering data through 2014, we expect 2014 economic impacts as measured by jobs, economic output, and additions to gross state product likely to have been higher than 2013.
The price decline, however, certainly resulted in a reduction in capital expenditures by exploration and production companies and thus, while production has remained relatively high to date, fewer completions and a slowdown in future production growth may be expected. If prices were to recover slightly, as reflected in the moderate (or low-moderate) forecast scenario, then similar increases in the economic impacts associated with the Texas pipeline industry would likely continue for at least several years.
The authors
Bradley T. Ewing ([email protected]) is the Rawls Endowed Professor of Energy Economics in the Department of Energy, Economics and Law at Texas Tech University, Lubbock, Tex. He formerly taught at Baylor University and is a partner in the PhD Resource Group LLC, an economic and business consulting firm. He holds a PhD in economics (1994) from Purdue University and MA and BBA degrees from Kent State University. He is on the editorial boards of several academic journals including the Journal of Economics and Finance and the Journal of Forensic Economics and is founding editor of the Journal of Business Valuation and Economic Loss Analysis.
Marshall Watson ([email protected]) holds the Roy Butler Chair and is department chair of the Bob L. Herd Department of Petroleum Engineering at Texas Tech University. His industry experience includes various positions at Shell Oil Co., Gaffney Cline & Associates, Ute Oil Co., and Harken Energy Corp. He holds a PhD (2008) and an MS (2005) in petroleum engineering from Texas Tech University and a BS from Cornell University, Ithaca, NY. He is a member of the Society of Petroleum Evaluation Engineers and the Society of Petroleum Engineers and is a registered petroleum engineer in Texas, New Mexico, Louisiana, and Wyoming.
