Delaware basin model quantifies SWD pressure effects
Injection patterns, injection rates, and injection pressures in saltwater disposal (SWD) wells in Delaware Mountain Group (DMG) formations will need to be revised and monitored to manage further SWD in the DMG.
Researchers at the University of Texas at Austin created a numerical flow model to map pore pressure evolution during SWD in the DMG of Delaware basin (DB). The model supports DMG reservoir monitoring, zonal containment, identification of existing fault reactivation or new fault creation, mechanics controlling land-surface displacement, and well planning.
The flow model was derived from detailed DMG stratigraphy models using injectivity to model a permeability field. Bottom-hole pressures (BHP) derived from measured wellhead injection pressures calibrated the regional model. Darcy’s law for single-phase flow modelled injection rates and pressures.
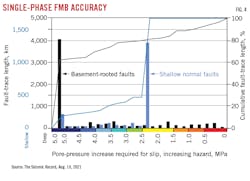
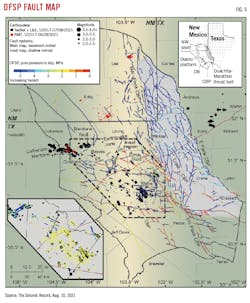
Modelled BHP from 1983 to 2020 show 100-400 psi increases in pore pressure, with 500 psi increases near some injection sites. This pressure is enough to laterally grow and connect faults, leading to active faulting. The southern part of DMG has more faulting than the north, therefore shallow SWD in southcentral DB is the primary driver inducing earthquakes.
Geological setting
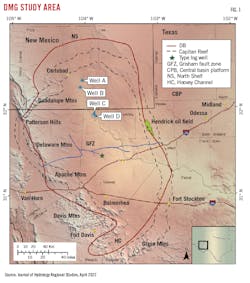
DB is a sub-basin of the Permian basin and covers an area of about 10,000 sq miles in west Texas and southern New Mexico (Fig. 1). It is bounded in the north by the North Shelf, in the west by the Diablo Platform, and in the east by the Central basin platform (CBP) which separates it from Midland basin. Sediments are mostly carbonate platform deposits and shales of Ordovician to Devonian age. Thickness of Paleozoic sediments is about 8,000 ft and the basin fill is more than 20,000 ft thick at its deepest. DB surface topography is a flat plateau with moderate elevation in the west. The Capitan Reef complex, comprised mostly of carbonates, rings the basin. It is shallow to the north where it crosses into New Mexico and hosts a freshwater aquifer. The western arm is exposed in the Guadalupe mountains.
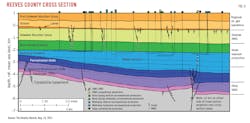
The DMG of DB is above Bone Spring and Wolfcamp formations and contains up to 4,500 ft of Guadalupian-age sandstone, siltstone, and detrital limestone in its mid-section. Cumulative thickness decreases below 2,000 ft at its northern and southern edges. It is divided into the Brushy Canyon, Cherry Canyon, and Bell Canyon formations in ascending stratigraphic order and permeability with average net sand volumes of 46%, 68%, and 70%, respectively (Fig. 2). Carbonate dominates DB margins, and Bell Canyon also contains carbonates which horizontally compartmentalize the formation.
The overlying Castile formation comprises an interval of the Ochoan series and is restricted to the DB proper. Castile anhydrite has a sharp, conformable transition with the top of the Bell Canyon formation, and interbedded halite appears often in the Ochoan Castile formation.
DMG and Capitan Reef are normally pressured, but some sections produce artesian water. Normally pressured formations flow south and east following the general Permian basin topographic slope. Low total dissolved solids (TDS) formation water in the western margin of DB suggests that the western area recharges through the fractured Capitan Reef and the DMG outcrop. The Capitan Reef aquifer and DMG are in direct contact with each other. Recharge in the DMG is directed east and southeast. DMG salinity varies from fresh to hypersaline with lower TDS in the western side of the DB, increasing to high values adjacent to the CBP, and low values on the Guadalupian carbonates of the CBP.
Production, injection
Conventional wells principally ran along the eastern and northern margins of the DB with production volume coming, in increasing order, from Brushy Canyon, Cherry Canyon, and Bell Canyon. Produced water from conventional DMG reservoirs (3.4 billion bbl to date) is reinjected into the reservoir for pressure maintenance, therefore DMG pressure decrease from conventional production is only from hydrocarbon extraction and this short-path water cycle can be neglected for pore pressure modelling purposes.
Wolfcamp and Bone Spring unconventional development provides most of the current production in DB, with the bulk of unconventional-well produced water injected into DMG formations both above and below petroleum-producing intervals. There are about 1,200 active SWD wells in the basin and, as of early 2022, there have been more than 15 billion bbl of water injected into the DMG via these wells.
Faulting, seismicity
Model data sources
The Railroad Commission of Texas (RRC) provided SWD injection data containing wellhead pressures and injection volumes. The data is collected monthly, but reported only yearly, resulting in a 15-month lag between the study and current state of the field. RRC also provided 23 records of BHP pressures and step-rate tests to confirm modelled initial pressure gradient.
Permeability data came from historical publications on about 80 fields in the DMG which were used to derive a porosity-permeability transform. Additional permeability data were obtained from recent RRC SWD permit files in which 15 step-rate tests estimated permeability.
Rock compressibility was estimated from literature data and bottomhole temperatures were obtained from measured data. Salinity came from the US Geological Survey Produced Waters Database and the New Mexico Water and Infrastructure data system.
Perforated intervals, well completion type (open or cased hole), and tubing dimensions were sourced from Enerdeq IHS Markit. Oil and gas production history, well locations, and target intervals also came from IHS.
Model extent, properties
The model targeted the DMG and Capitan Reef formations in DB including parts of eight counties in west Texas and Lea and Eddy counties in southeast New Mexico. Areal extent is constrained by Capitan Reef to the east and north and the DMG outcrop to the west, with no-flow boundaries assumed for all sides. Most injection is in the eastern half of the DB, not far from the Capitan Reef.
While faults exist in the DMG, many are minor and have small throws compared with the thickness of the modeled units and uncertain properties. The model therefore omits explicit faulting, but faults are implicitly included using injectivity-derived permeability values.
The top of the model is the top of the Bell Canyon formation, and the bottom of the model is the bottom of the Brushy Canyon formation. Top and bottom are assumed to be no-flow boundaries due to significant contrast in matrix permeability. Aquifer recharge from meteoric water is assumed minimal.
A geocellular Petrel model defined the reservoir, with formation tops obtained from 1,090 wells in the study area. Bell Canyon, Cherry Canyon, and Brushy Canyon formations in the DMG were identified from these correlated tops. The model included sandstone, siltstone, and carbonate lithologies with varying formation thicknesses and pinch-out at some locations.
Computer Modelling Group Ltd. CMG-Stars software simulated pore pressure. Six evenly split layers each for the three DMG formations model short perforated SWD intervals. Capitan Reef contains 12 layers. Average grid-cell thickness is 163 ft, with the grid aligned NNW-SSE.
Petrel constructed a porosity field from geostatistical analysis using porosity data from 334 wells with petrophysical logs. Log-interpreted porosities ranged from 10-25% for sandstones, 5-10% for siltstones, and less than 5% for carbonates. Mean porosity of Bell Canyon and Cherry Canyon formations were higher than that of Bushy Canyon formations.
A permeability field was constructed from a porosity-permeability correlation derived from SWD injectivity data and core data. Over 9,000 datapoints defined the correlation. Average permeability is about 18 md with typical values ranging from 0.4-200 md. Bell Canyon and Cherry Canyon formations generally have higher permeability than the Brushy Canyon formation.
The base case model does not include horizontal permeability anisotropy and assigns vertical permeability at 10% of horizontal permeability based on low-permeability carbonate layers between Brushy Canyon and Cherry Canyon and between Cherry Canyon and Bell Canyon intervals. Rock compressibility was estimated at 7.5 ✕ 10-6 psi-1, consistent with other studies.
The study assumed that DB water production and injection from conventional wells cancelled each other and were therefore not included in the model. Water production from DMG unconventional wells, however, amounted to 0.42 billion bbls and is tracked in the model. Typical injection rates ranged from 1,000-8,000 b/d, with high-rate wells injecting more than 60,000 b/d into the Bell Canyon formation. Most SWD well perforations are in the Bell Canyon formation, followed by the Cherry Canyon formation. Fewer wells are perforated in the Brushy Canyon formation.
DMG cumulative oil production is about 0.6 billion bbl (standard conditions) and is included in the flow model. Most DMG oil has 38-42° API gravity. Initial gas oil ratio (GOR) is about 4,000 cu ft/bbl at standard conditions and equivalent reservoir volume is 1.6 reservoir bbl/std bbl. Oil production was assigned to 1-mile square grid cells corresponding to the field location and depth. Solution-gas effects were neglected as they exhausted quickly with small areal effect compared with the size of the basin model.
Initial model pressures and temperatures came from drillstem test measurements. Pressure distribution in the model assumed hydrostatic conditions with reference point in the highest-elevation cell. The modelled initial pressure gradient was 0.49 psi/ft, and initial pressures ranged from 174-4,050 psi.
Average geothermal gradient is 1.25° F./100 ft. Temperature is independent of rock properties and ranges from 64-167° F. with 64° F. injected water temperature which quickly reaches thermal equilibrium with reservoir cell temperatures. Gridblocks are isothermal, with temperature dictated by depth. Individual cell temperatures can vary.
Total dissolved solids (TDS) in the DMG ranges from fresh to brackish, depending on location. Salinity distribution generally correlates with depth and was modeled by a linear function which is a mixture of 900-ppm fresh water at the shallowest depth and 250,000-ppm saline water at the deepest depth. Injection water salinity was 60,000 ppm based on an average of injection water data. Gridblock salinity evolved over time with injection and related flow.
Most SWD well perforations are in the Bell Canyon formation, followed by the Cherry Canyon formation, and the least in the Brushy Canyon formation. SWD completion intervals in the DMG are not long enough to hydraulically connect all three formations which, combined with strong vertical anisotropy, differentiates vertical pressure buildup.
Model calibration
The DMG flow system initial state was set at equilibrium before injection. BHP model calibration came from converting qualified wellhead flowing pressures to BHP using head and friction losses. Where field BHP was available, modeled BHP matched field data within 2-10%.
Sensitivity analysis determined critical parameters for pressure estimates. Porosity, horizontal and vertical permeability, horizontal permeability anisotropy, compressibility, temperature gradient, and formation- and injection-water salinity were varied from base case values. Sensitivity was determined though pressure differences between the start of injection and the last time-step for each parameter.
Sensitivity analysis shows that pressure increase is sensitive to horizontal permeability and compressibility. Horizontal permeability controls pressure buildup and plume size. A 5✕ multiplier applied uniformly to the permeability field resulted in a 30-60% decrease in pressure buildup, but a 0.2✕ multiplier caused an equivalent pressure increase.
Compressibility controls pressure diffusion and is the second most important parameter in model sensitivity, with doubling or halving rock compressibility causing a 30-35% change in pressure buildup. Addition of horizontal permeability anisotropy in either direction increased pressure differentials by about 10%.
The effects from porosity, vertical permeability, temperature, and salinity are relatively small compared with horizontal permeability and compressibility. Vertical permeability controls vertical exchanges between upper and lower layers, not the SWD which has long injection intervals. Salinity of both formation water and injected water has a limited impact on pore pressure differentials.
Model results
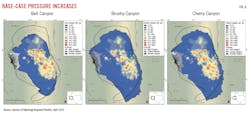
The base model scenario injected about 5.8 billion bbl water through injection wells into the DMG. Fig. 6 shows base case modeled pressure increases (ΔP) in top layers of Bell Canyon, Cherry Canyon, and Brushy Canyon. Bell Canyon and Cherry Canyon formations have larger plume sizes but with smaller pressure buildups than Brushy Canyon. Base case simulation shows pressure buildups among the formations ranging from 100-400 psi and locally exceeding 500 psi near some injection sites.
A sensitivity run included base case water injection but extracted about 600 million bbl oil from the DMG. The resultant pressure buildups were 10-40 psi lower than base case and indicated that pore pressure effects from DMG oil extraction were small compared with SWD injection. A second sensitivity run included historic water production in addition to oil extraction and yielded smaller overall pressure effects than base case, but pressure increases were still typically around 50-300 psi.
Inclusion of Capitan Reef in the model relieves some pore-pressure differentials at the edge of the DB (by as much as 20 psi at some points), but its inclusion does not significantly influence overall pressure evolution in the DMG because the main injection centers are mostly away from the boundaries of the DB’s boundaries.
Even with oil and related water production limiting pore pressure increase, especially around production sites, the remaining 300 psi increase from SWD is enough for faults to grow laterally and connect, actively causing faulting. The southern part of DMG has more faulting than the north, therefore shallow SWD in southcentral DB, principally into Devonian units, induces earthquakes.
The flow model suggests that, if recent injection trends persist, SWD wells in DMG formations will need coordinated injection management. New injection wells will be needed across the region to spread the injection out more evenly, and current areas of injection must be reassessed to determine whether they can or should continue as currently utilized. High-quality downhole pressure data is critical for ongoing operations and model validation.
Produced water volume estimates during the productive life of DB are about 250 billion bbl. Injection patterns, rates, and pressures will need to be revised to safely and effectively manage the finite SWD capacity of the DMG. The flow model will help guide this management.
Bibliography
Ge, J., Nicot, J.-P., Hennings, P.H., Smye, K.M., Hosseini, S.A., Gao, R.S., and Breton, C.L., “Recent water disposal and pore pressure evolution in the Delaware Mountain Group, Delaware Basin, Southeast New Mexico and West Texas, USA,” 101041, Journal of Hydrology Regional Studies, Vol. 20, April 2022.
Hennings, P., Dvory, N., Horne, E., Li, P., Savvaidis, A., and Zoback, M., “Stability of the Fault Systems That Hose-Induced Earthquakes in the Delaware Basin of West Texas and Southeast New Mexico,” The Seismic Record, Vol. 1, No. 2, Aug. 10, 2021, pp. 96-106.
Smye, K., Banerji, A., Eastwood, R., McDaid, G., and Hennings, P., “Lithology and Reservoir Properties of the Delaware Mountain Group of the Delaware Basin and Implications for Saltwater Disposal and Induced Seismicity,” Journal of Sedimentary Research, Vol. 91, No. 11, Nov. 5, 2021, pp. 1,113-1,132.
About the Author
Alex Procyk
Upstream Editor
Alex Procyk is Upstream Editor at Oil & Gas Journal. He has also served as a principal technical professional at Halliburton and as a completion engineer at ConocoPhillips. He holds a BS in chemistry (1987) from Kent State University and a PhD in chemistry (1992) from Carnegie Mellon University. He is a member of the Society of Petroleum Engineers (SPE).
