Oil market recovery stays the course amid risks
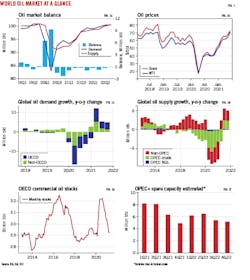
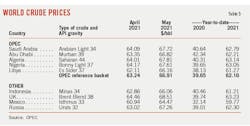
Oil prices have risen sharply with Brent oil prices averaging $64/bbl in 2021 so far and reaching above $75/bbl in mid-June. Prices are supported by a gradual strengthening of oil demand as COVID-19 vaccinations roll out, and OPEC and its alliance (OPEC+) continue production guardianship.
Although the COVID-19 pandemic is not yet over, global oil demand will continue to recover. In major OECD countries with high vaccination rates, consumers are increasingly using cars and airplanes. Global access to vaccines is expected to improve in second-half 2021, as vaccine manufacturers suggest ramping up supply.
However, downside risks to oil demand remain significant. Uneven vaccine distribution could jeopardize non-OECD oil demand recovery. Further virus mutations, such as the recent highly contagious Delta variant, could drive a prolonged slowdown in oil demand with further lockdowns. Moreover, high oil prices could be a real burden for some oil importing countries.
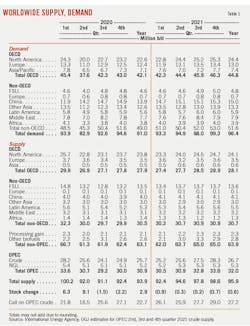
Global oil demand averaged 94 million b/d in first-half 2021, compared to 88.4 million b/d in first-half 2020, and 99.2 million b/d for the same period of 2019. For 2021 as a whole, global oil demand is expected to average 96.4 million b/d, compared to 91 million b/d in 2020, and 99.7 million b/d in 2019. By end-2021 or early next year, oil demand could be near 99% of its pre-pandemic level.
Oil demand recovery, coupled with nearly a year of robust supply restraint from OPEC+, has drained down bloated world oil inventories that built up during last year’s COVID-19 demand shock. Since reaching an all-time high of 3,218 million bbl in July 2020, OECD industry stocks have drawn on average by 1.1 million b/d through April 2021 (the latest data available). April 2021 was the first time in more than a year that OECD total industry stocks fell below the corresponding 2015-19 average.
OPEC+ reduced production by a record 9.7 million b/d last year as demand collapsed due to the pandemic. In April 2021, with confidence in improving oil demand and a drop in the global supply glut, OPEC+ decided to return 2.1 million b/d of supply to the market during May through July. At its June 1 meeting, OPEC+ reaffirmed its commitment to continued production increases in the coming months. However, the pace at which the OPEC+ cuts to be unwound would depend not only on the success of curbing the virus and increased demand, but also on the timing of the eventual return of Iranian oil to the market.
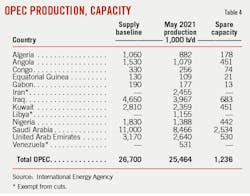
Meantime, with unremitting capacity additions, OPEC+ will continue to have high spare capacity through next year even with higher call. Although its spare capacity is high, OPEC can decide to unwind it slowly and keep the market tighter for longer.
Non-OPEC+ supply will recover partially this year from last year’s drop. There has been rising ESG related pressures on publicly listed oil companies, curbing capital spending. Meantime, US shale companies have muted responses to high oil prices, reflecting their “maintenance mode” capital programs.
All these combined could give OPEC additional room for market management. In 2022, however, as new projects come online and ramp up production, and as US shale oil ramps back up, there could be a boost in non-OPEC+ supply.
For the remainder of 2021, planned OPEC+ production increases and higher non-OPEC+ production contribute to a forecast of a more balanced market. This could end the large stock draws seen in late 2020 and early 2021 and limit further gains in crude oil prices. In 2022, OGJ expects a largely balanced oil market with further demand normalization and adequate supply.
Risks to the forecast include: (1) major mutations of the virus may affect the recovery of oil demand, causing the market to fall into surplus again (2) OPEC+ can decide to shift from price targeting to market share targeting, promoting market surplus.
In addition, inflation is a powerful tailwind for commodities, including crude oil. With hotter than expected inflation, the Fed has bumped up its timetable for interest rate increases. Stronger dollar or a reversal of the inflation narrative could put pressure on crude oil prices.
World economy, mobility
The negative impact on world economic growth from countries suffering from renewed COVID cases has been more than offset by vigorous activity of those that have reached a certain degree of vaccination saturation. Substantial US fiscal stimulus is also supportive to economic recovery.
The JP Morgan Global Composite Output Index rose to 58.4 in May, a 181-month high, and remained above 50 for 11 successive months. The US and Europe are expanding rapidly as vaccinations are gradually allowing countries to reopen.
According to the World Bank’s latest forecasts, global real GDP is expected to grow 5.6% in 2021, a sharp upward revision from the projections made late 2020. The OECD’s economic outlook released at the end of May expects global growth in 2021 to be around 5.8%, compared to its December 2020 projection of 4.2%. The latest Oxford Economics outlook expects world output growth for 2021 to be 6.4%. However, despite the strong recovery, the global GDP level in 2021 is estimated to be around 3% lower than the pre-pandemic forecast.
According to the World Bank, the OECD region’s output will rise 5.4% in 2021, following a decrease of 4.7% in 2020. The US economy will rise by 6.8%, OECD Europe will grow 4.2% in 2021, and Japan will grow 2.9%. The non-OECD region will grow 6% in 2021. China will grow 8.5% and India will grow 8.3%. Forecasts lag for many emerging markets and low-income countries.
In 2022, global growth is forecast to remain robust (+4.3%), albeit at a slower pace than 2021. The outlook for the US is particularly strong, thanks to the $2.7 trillion American Jobs Plan and new infrastructure spending.
According to the New York Times, as of June 26, more than 2.88 billion vaccine doses have been administered worldwide, equal to 38 doses for every 100 people. There is already a stark gap between vaccination programs in different countries. If manufacturers increase vaccine production as indicated, the supply of vaccines may increase substantially in second-half 2021. According to public plans, by the end of September and December, cumulative production may increase to 6 billion doses and 9.7 billion doses.
Global mobility is improving but unevenly. In Europe and the US, mobility jumped as vaccinations are now allowing countries to reopen. The drop in mobility due to rising COVID cases was critical in India and Thailand during May, but the situation appears to be improving. The situation in Brazil is also improving. Japan, Malaysia, and Taiwan, however, have recently implemented strong measures to control the spreading of the virus.
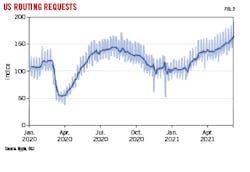
The Apple Mobility indices for global driving, based on regional routing requests and weighted by oil demand, have been increasing steadily since early this year. The indices reached 130 in June 2021, compared to 95 in February. The growth was mainly supported by the US and Europe.
World oil demand
Global oil consumption continues to recover from the COVID-19 plunge. For first-half 2021, estimated global oil demand averaged 96.4 million b/d, up 5.68 million b/d year-on-year. Nevertheless, the demand level is well short of its pre-pandemic level of 99.7 million b/d.
Demand from OECD countries increased by 1.87 million b/d (+4.5%) over the first half. Non-OECD demand increased by 3.8 million b/d (+5.43%), with China alone contributing 1.8 million b/d (+13.96%).
The recovery of oil demand is increasingly uneven amongst regions. Advanced economies have, in general, seen substantial vaccination progress and rapid recovery in economy and oil demand, while in many emerging economies, due to slow vaccine distribution, the pandemic continues to drag down economic growth and oil demand.
With increased availability of vaccines around the world, oil demand normalization will likely accelerate during the second half of the year. However, new virus variants could possibly cause a slowdown in oil demand growth if vaccines are less effective against them.
According to the latest forecast from the International Energy Agency (IEA), for 2021 as a whole, world oil consumption will increase by 5.36 million b/d year-over-year to average 96.39 million b/d, partially recovered from the 8.6 million b/d drop last year. OECD demand will increase by 2.7 million b/d, while non-OECD demand will increase by 2.66 million b/d.
Demand in OECD Americas will increase by 1.87 million b/d, or 8.29%, this year, following a 3.09 million b/d contraction (-12.05%) in 2020. OECD European oil demand will expand 4.42% to 12.98 million b/d this year. Demand in OECD Asia will climb by 290,000 b/d from a year ago, following a decline of 720,000 b/d last year.
Non-OECD oil demand will grow by 2.66 million b/d this year, following a 3.02 million b/d decline in 2020. Chinese oil demand is expected to expand by 1.1 million b/d in 2021. India oil demand is expected to average 4.81 million b/d this year, a growth of 280,000 b/d over last year.
Petrochemical demand has been relatively spared from the COVID crisis. LPG/ethane deliveries were already 6% higher than the 2019 level in second-quarter 2021. Gasoline and distillate are both expected to be near their pre-pandemic levels by early next year.
By contrast, jet fuel and kerosene demand remain a significant obstacle to a broader recovery, owing to the slow reopening of borders and reduced business travel. The International Air Travel Association (IATA) expects the total number of air passengers to reach 52% of 2019 levels in 2021, rising to 88% of pre-COVID levels in 2022, and exceeding 2019 levels in 2023.
Some changes brought about by the pandemic will likely be a feature of near-term demand. Some teleworking will likely remain. According to IEA’s estimation, teleworking would reduce world gasoline demand by 300,000 b/d to 350,000 b/d.
In addition, higher electric vehicle sales and increased car efficiencies for new models will weigh on growth.
Supported by impressive sales in Europe, electric vehicle sales rose to 3 million in 2020 from 2.1 million units in 2019. However, in the short term, EVs remain largely a China and Europe phenomena. Even with strong growth, the impact of EV sales on world gasoline and diesel demand may be relatively limited in the time horizon of the forecast, according to IEA. Instead, improvement in the internal combustion engine (ICE) car fleet efficiency, as older cars get retired and replaced, may have a stronger impact.
World oil supply
After a drop of 6.6 million b/d, world oil output is now forecast to increase about 1.9 million b/d in 2021. In 2022, world oil supply growth is expected to accelerate to around 3.7 million b/d, OGJ forecasts.
In first-quarter 2021, OPEC+ continued to restrain supply to normalize global inventories. The group’s crude production was 970,000 b/d below the IEA’s estimated call on average.
In May, Saudi Arabia began to phase out its 1 million b/d voluntary reduction along with an overall easing of cuts by OPEC+. As of July, the restrictions still in place will remain at 5.8 million b/d. Although OPEC+ output climbed in the second quarter, estimated production was well below the IEA’s estimated call with increased demand.
In the second half of the year, as the normalization of demand speeds up, OPEC+ is expected to accelerate its production growth even with the return of Iranian oil.
Iranian oil supply will be a wild card. Should an agreement of restoring the nuclear deal be reached, Iranian crude supply could rise by 750,000 b/d to 3.15 million b/d by the end of this year and ramp up to full capacity of 3.8 million b/d by second-half 2022, according to IEA. If that happens, Iran may rank as the world’s largest source of oil supply growth in 2022. However, Iranian hard-liner Ebrahim Raisi won the presidency, which could add uncertainties to restarting the Iranian nuclear deal.
Despite significant production cuts for more than a year, Saudi Arabia, the UAE, and Russia are still spending money to expand or at least maintain production capacity. Overall, OPEC+’s production capacity is expected to reach 50.37 million b/d in 2021, and 50.55 million b/d in 2022.
According to IEA estimates, OPEC+ effective spare capacity (excluding shut-in Iranian crude) in 2021 would fall to 5 million b/d in the fourth quarter but throughout 2022 it could stand above 5 million b/d given the planned capacity expansions. However, OPEC would be able to release idle capacity slower in the near future, making the market tighter for longer.
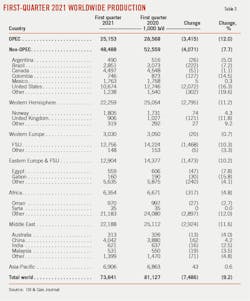
In first-half 2021, non-OPEC+ supply was negatively impacted by US production outages during the February cold snap and heavier-than-usual seasonal maintenance in Canada, Brazil, and the North Sea. In the second half, non-OPEC+ supply is expected to see larger gains, driven by new projects in Brazil and Norway, and as US production increases. For 2021 as a whole, non-OPEC+ supply is likely to rise 700,000 b/d.
US crude oil production dropped to 11.3 million b/d in 2020 from 12.25 million b/d in 2019. In 2021, as public-listed companies continue disciplined spending, overall recovery has remained sluggish. With limited new drilling, US companies are bringing the drilled but uncompleted (DUC) wells online at a faster rate. However, the recent increase in oil prices has triggered private operators (some 25% of US light tight oil supply) to step up drilling. For whole-year 2021, US crude oil production is expected to decline further by 133,000 b/d.
Production in other major non-OPEC+ countries, including Canada, Brazil, Norway, and Guyana, will continue to grow substantially as projects ramp up and new fields come online.
Canadian production in 2021 is set to increase 6.21% to 5.64 million b/d. However, gains of 300,000 b/d in 2021 will likely slow to 170,000 b/d in 2022, due to lack of new project sanctions. Production from offshore Terra Nova field is full of uncertainty, as operator Suncor looks to sell the FPSO and decommission remaining facilities.
With Johan Sverdrup field online as of late 2019, Norwegian oil production in 2020 increased 15% to 2 million b/d. The country’s production is expected to grow 6% to 2.12 million b/d this year with Johan Sverdrup’s 535,000 b/d and other smaller projects expected to come online.
Boosted by strong production from the presalt horizon, Brazilian total oil production in 2020 increased 5.17% to 3.05 million b/d. The country’s production is expected to rise to 3.14 million b/d this year and 3.28 million b/d next year.
Noticeably, there has been mounting pressure on publicly listed oil companies (mostly non-OPEC producers) regarding ESG and climate concerns. Shareholders are increasingly demanding public oil companies set strategy and capex plans based on a net-zero scenario.
According to Morgan Stanley, global upstream capex already fell around 40% in 2014-19, and declined another 30% in 2020. Without any capex recovery from 2020, oil and gas production from public companies will fall from 2024 onwards. This may pave the way for continued OPEC market management.
Global oil inventory
Global oil inventories have fallen as OPEC+ production has remained constrained and consumption has gradually recovered. OECD industry stocks held relatively steady in April at 2,926 million bbl but fell 1.6 million bbl below the pre-COVID 2015-19 average for the first time in more than a year.
OECD on land inventories, which had risen by nearly 10% in first-half 2020, have since declined sharply. Inventories held in floating storage have also fallen to close to the pre-pandemic level.
Outside of the OECD, most of the increase in inventories occurred in China, which took advantage of low prices to build both commercial and government stockpiles. Other countries, including India and Australia, also increased strategic reserves.
US oil demand
The recovery of US economy is gaining pace. The Institute for Supply Management’s manufacturing PMI had a reading of 61.2 in May. The index has exceeded the threshold of 50 for 12 consecutive months. According to the Bureau of Labor Statistics (BLS), US non-farm payrolls increased by 559,000, and the unemployment rate declined by 0.3 percentage points to 5.8% in May.
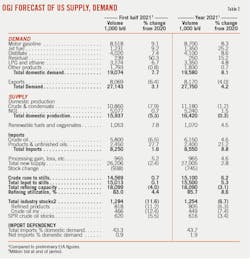
Increasing travel and economic activity in the US have combined to drive increased oil demand. Over first-half 2021, US oil demand increased 7.7% to 19.07 million b/d year-over-year. However, the first half average demand was still 93.4% of its 2019 level. OGJ forecasts that total US oil demand will average 19.6 million b/d in 2021, a growth of 1.5 million b/d (+8.1%) from the 2020 level.
Although the demand for gasoline, distillate, and jet fuel has increased from 2020 lows, the speed and extent of the growth vary from product to product.
Rebounded motor gasoline consumption leads the growth. US gasoline demand resumed solid growing in March 2021, and consumption rose above 9 million b/d during the week ended May 21 for the first time since March 20, 2020. Increasing US gasoline consumption is consistent with trends seen in Google or Apple mobility data (Fig.2).
According to Energy Information Administration (EIA) data, the first half average demand for gasoline was 8.52 million b/d, compared to 7.8 million b/d for the same period in 2020. OGJ forecasts that for whole-year 2021, US gasoline demand will increase 8.3% to 8.7 million b/d, 94% of the 2019 level.
COVID-19 did not affect distillate consumption as much as gasoline or jet fuel consumption. From end 2020 to the beginning of April 2021, products supplied for distillate were close to the 2019 level, and in April 2021 exceeded it. Distillate consumption is supported by truck transportation and railway demand.
According to the American Trucking Association, the truck tonnage index is much higher than last year’s low levels. In addition to high trucking demand, weekly data from the American Association of Railroads indicate rail traffic in 2021 is generally trending near 2019 levels except for a sharp decrease in February due to extreme winter weather.
OGJ forecasts that for whole-year 2021, US distillate demand will increase 8.6% from a year ago to 4.1 million b/d, back to the 2019 level.
With the increase in personal travel, demand for jet fuel in the US also has increased from 2020 lows, but not as close to 2019 levels as gasoline and distillate. The first half average demand for jet fuel was 1.23 million b/d, compared to 1.13 million b/d for the same period in 2020. The demand was 72% of its 2019 level. As of end June, product supplied data indicate it is more than 25% below 2019 levels for the same time of year.
In February 2021, extremely cold weather on the US Gulf Coast caused the shutdown of most petrochemical plants in the region, resulting in the largest monthly drop in ethane feedstock demand (-654,000 b/d) on record. Despite the shock, LPG/ethane demand has averaged 3.27 million b/d in first-half 2021, 4% higher than the 2019 level. Thanks to strong petrochemical demand, OGJ forecasts that for whole-year 2021, US LPG/ethane consumption will average 3.35 million b/d, up from 3.2 million b/d in 2020, and 3.14 million b/d in 2021.
US oil production
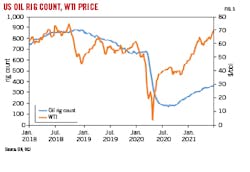
Although WTI prices have risen to above $70/bbl this year, activity in US light tight oil is still far below pre-pandemic levels. The response of US shale operators to higher oil prices seems much more muted than in the past.
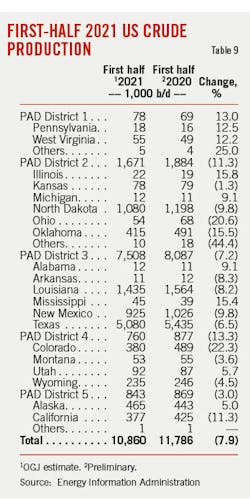
US crude oil production averaged 10.86 million b/d in first-half 2021, compared to 11.78 million b/d and 12 million b/d over the same periods in 2020 and 2019, respectively.
Growing shareholder pressure has pushed US shale companies to prioritize free cash flow and returns over growth. Strict capital discipline, coupled with other factors including the threat of OPEC’s spare capacity, ESG pressure, and labor restrictions, have led to a milder recovery than in the past.
Nevertheless, the recent increase in oil prices has triggered private operators (some 25% of US LTO supply) to step up drilling, according to Rystad Energy.
The number of active US oil rigs was 372 for the week ended June 25, 2021, compared to 188 active oil rigs a year ago and 793 for the same time in 2019, according to Baker Hughes.
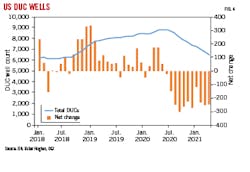
In the meantime, the number of wells completed and started has strongly recovered, but the number of wells spudded (new drilling) is still far behind. As a result, the inventory of DUC wells has been drawing rapidly. Moreover, data from Rystad Energy indicates that US shale operators are already drawing down on young DUC wells (less than 3 months old), something not seen in past recoveries.
US LTO production is expected to increase during the remainder of the year. These gains come mainly from the Permian basin. More fracturing and completions have been observed in the basin, but most operators are committed to earlier restricted investment and production guidance.
In the Gulf of Mexico, eight new projects began production in 2020. However, annual production (1.65 million b/d) was lower than 2019 levels (1.9 million b/d) because of pandemic-related shut-ins and the most active Atlantic hurricane season on record.
The Gulf of Mexico is expected to see crude production growth in 2021 and 2022, driven by new projects coming online. Four of the new projects will likely begin production in 2021, with nine more in 2022. By end 2022, 13 new projects could account for about 12% of total Gulf of Mexico crude oil production, or about 200,000 b/d.
OGJ forecasts US crude oil production to average 11.18 million b/d in 2021, down 1.2% from 2020. US natural gas liquids (NGL) production increased 5.8% in 2020 to 5.1 million b/d and will continue to increase to 5.24 million b/d this year, OGJ forecasts.
In 2022, US oil production is expected to rebound by nearly 1 million b/d, thanks to increased activity in the shale patch, higher production from the Gulf of Mexico, and higher NGL supply.
US refining
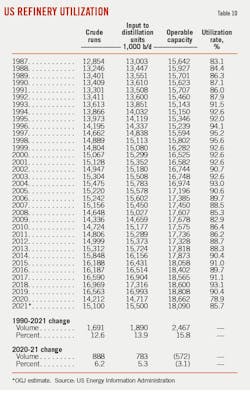
US refining activities are recovering but remain subdued compared to pre-pandemic levels. Gross inputs to US petroleum refineries, or refinery runs, averaged 15.75 million b/d in May 2021, compared to 12.96 million b/d in May 2020, but still well below the 17.04 million b/d in May 2019.
US refiners ran at an averaged utilization rate of 82.95% in first-half 2021, compared to 79.53% in the same period a year ago. For whole-year 2021, OGJ forecasts an average utilization rate of 85.7%, compared to 79.21% in 2020, and 90.3% in 2019.
US refining capacity averaged 18.1 million b/cd in first-half 2021, down from 18.86 million b/cd for first-half 2020. US refining capacity reached a record high of nearly 19 million b/cd earlier in 2020, but several refineries have since closed, and capacity fell to the lowest level since May 2016.
The Philadelphia Energy Solutions refinery in Pennsylvania (335,000 b/cd) closed in May 2020. Operable capacity fell by another 19,000 b/cd in June 2020 when Marathon’s refinery in Dickinson, ND, was converted to a renewable diesel plant. The further decline in operable capacity continues to reflect recent refinery closures for converting to renewable diesel production.
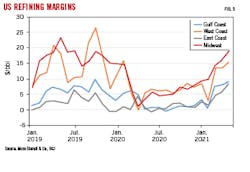
As the reopening of the US continues to gain momentum, coupled with relatively lagged refinery production, refining margins are ramping up. Robust gasoline demand has served as the primary driver of a recovery in broader refining margins.
Refining cash margins for the first 5 months of 2021 averaged $13.91/bbl for the Midwest, $10.85/bbl for the West Coast, $5.75/bbl for the Gulf Coast, and $4.68/bbl for the East Coast, according to Muse Stancil & Co. The average cash refining margins for these refining centers averaged $8.22/bbl, $7.71/bbl, $4.02/bbl, and $1.18/bbl, respectively in 2020. For the same period in 2019, these refining margins averaged $16.55/bbl, $14.05/bbl, $4.78/bbl, and $1.77/bbl.
US oil trade
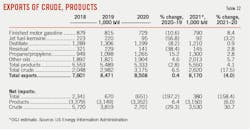
Over first-half 2021, US product net exports averaged 3.04 million b/d, down from 3.5 million b/d for the same period a year ago, reflecting rising domestic product demand and rising product imports. US product net exports averaged 3.06 million b/d over first-half 2019.
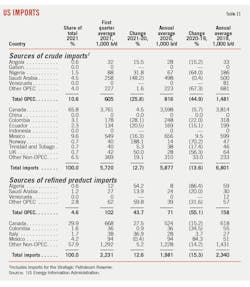
Estimated US crude oil net imports averaged 3.1 million b/d in first-half 2021, compared to 2.99 million b/d for first-half 2020. Over the first half of this year, averaged US crude oil imports and exports were both lower than the year-ago level. For first-half 2019, crude oil net imports averaged 4.2 million b/d.
OGJ expects US crude oil imports will ramp up in second-half 2021, reflecting rising refining activities. On an annual basis, US crude oil imports in 2021 will surpass the year-ago level but will remain below the pre-pandemic level.
OGJ forecasts net imports of crude oil will increase from the 2020 average of 2.7 million b/d to around 3.5 million b/d in 2021.
The year 2020 marked the first year that the US exported more petroleum than it imported on an annual basis. However, as US domestic crude oil production continues to decline and crude oil imports increase, the US is expected to return to a net petroleum importer on an annual basis in 2021 and 2022.
On an annual average basis, US net petroleum product exports averaged 3.15 million b/d in 2019 and 3.4 million b/d in 2020. OGJ forecasts that net petroleum product exports will average 3.15 million b/d in 2021.
US oil stocks
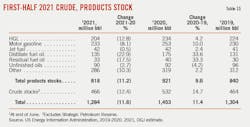
At midyear 2021, sluggish domestic crude oil production, a recovery in refining inputs, combined with lower crude oil imports over the first half, resulted in a sharp decline in crude oil stocks versus the year-ago level.
Estimated industry crude oil stocks stood at 466 million bbl, down 12% from 532 million bbl a year ago. The amount of crude oil in the Strategic Petroleum Reserve stood at 620 million bbl, compared to 656 million bbl a year ago.
Meantime, as increases in product consumption have outpaced increases in production and net imports in recent months, total product stocks at midyear 2021 were down 11% from the year-ago level.
Motor gasoline inventories stood at 233 million bbl at end June 2021, down 8% from 253 million bbl at end June 2020. Distillate fuel oil stocks moved to 135 million bbl, down 23% from a year ago.
Due to weather-related power outages in February, gasoline inventories fell sharply. After the interruptions, gasoline consumption increased from March through May. Increased gasoline consumption and supply disruptions have placed monthly gasoline inventories below the 5-year averages every month in 2021.
US natural gas
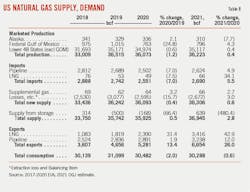
Record high US LNG exports, in combination with stable US natural gas production, reduced storage levels and supported US gas prices. The February 2021, a North American cold wave drove extremely high natural gas prices, setting annual average price higher.
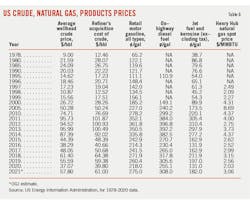
For first-half 2021, Henry Hub natural gas spot prices averaged $3.2/MMbtu compared with $1.8/MMbtu over the same period a year ago. For whole-year 2021, Henry Hub natural gas spot prices are expected to average $3.06/MMbtu, compared to a record low of $2.03/MMbtu in 2020, and $2.57/MMbtu in 2019.
In mid-2020 when Europe TTF prices and Asia spot LNG prices fell below $2/MMbtu, US LNG exports were hard hit. According to Rystad Energy’s estimates, about 12 million tones (Mt) of US LNG exports were shut in last year as a result of the market crash. However, US LNG exports have rebounded rapidly since September 2020, as Asia LNG prices soared due to an extremely cold winter and international LNG supplies declined due to unexpected outages in major producing countries.
According to the EIA, every month from November 2020 to May 2021 has been among the 10 highest for US LNG exports on record.
Continued strong US LNG exports in 2021 reflect greater-than-usual global restocking demand. LNG stocks in Asia have been lower than usual this year because of significant draws during the extremely cold winter. In Europe, the coldest April in nearly a century and low inventories also supported higher demand. The Japan-Korea Marker (JKM) price exceeded $10/MMbtu this May, compared with May 2019 and 2020 averages near $5/MMbtu and $2/MMbtu, respectively. The TTF prices in Europe reached $8.98/MMbtu in May, compared to $1.4/MMbtu and $4.3/MMbtu for the same time in 2020 and 2019.
In 2021, US LNG exports are expected to expand 43% to more than 9 bcfd. This compares with annual averages of 6.5 bcfd in 2020 and only 5 bcfd in 2019. Moreover, US LNG exports will exceed natural gas exports by pipeline on an annual basis in 2021.
Ongoing high US LNG exports supported Henry Hub natural gas futures prices above $3/MMbtu. Although futures prices have risen, futures price volatility has declined to low levels.
US pipeline exports to Mexico increased by 7% in 2020 compared with 2019 as a result of completion of a new segment of the Wahalajara pipeline system and Centro de Control del Gas Natural’s (Cenagas) Cempoala compressor station (OGJ Online, July 6, 2020). Completion of Grupo Carso’s Samalayuca-Sásabe pipeline in January 2021 and the expected completion of TC Energy’s Tula-Villa de Reyes pipeline later in 2021 are expected to further increase US pipeline exports to Mexico.
Due to pandemic impacts, US domestic natural gas consumption in 2020 declined 2% from the previous year. In first-half 2021, US natural gas consumption averaged 85.13 bcfd, largely flat with the year-ago period. For full-year 2021, US natural gas consumption is expected to decrease further by 0.6% from a year ago, averaging 83 bcfd, OGJ forecasts. The decrease mainly reflects lower natural gas consumption in the power generation sector.
Over the first 6 months of this year, natural gas consumed by power generation averaged 26.9 bcfd, down from 29.3 bcfd for the same period a year ago, reflecting much higher gas prices (OGJ estimates that the price elasticity of gas consumption in the power generation sector is around -0.2). Natural gas consumed by power generation is expected to drop 7.4% in 2021.
In contrast to lower gas consumption in power generation, coal-fired generation has increased nearly 40% during the first 4 months of 2021 compared with the same period in 2020, according to EIA’s Hourly Electric Grid Monitor data. Natural gas power generation is also facing increased competition from renewable generation in the US. In 2021, renewables account for most new US electricity generating capacity.
In February 2021, a record-breaking cold snap hit the Lower 48 states. It affected natural gas production and industrial sector consumption the most, which had the largest monthly declines on record, while residential sector consumption reached a record high.
OGJ forecasts that industrial demand for natural gas will expand 3% in 2021 to above 23 bcfd. Natural gas consumption in the commercial and residential sectors will increase by 5-6%.
Total marketed production and dry natural gas production averaged 98.8 bcfd and 91.3 bcfd in 2020, down 1.2% and 1.8% respectively from a year earlier. Lower gas production in mid and late 2020 was partly offset by record high production early in the year.
Spurred by higher gas prices and surging exports, US gas drilling activity began to rise in the last quarter of 2020. As of June 25, 98 active rigs were drilling for natural gas, compared with a low of 68 in July 2020. Oil-directed activity can also increase natural gas production because of the associated natural gas recovered from rising oil production.
US natural gas production in February 2021, when weather-related well freeze-offs contributed to production shut ins, decreased nearly 7% from January to 92.4 bcfd, the largest monthly decline on record. Excluding February, US monthly marketed gas production averaged 99.7 bcfd so far this year.
Marketed natural gas production in the Gulf of Mexico averaged 2.1 bcfd in 2020, down from 2.78 bcfd in 2019. US marketed gas production in the Gulf of Mexico will average 2.18 bcfd in 2021, OGJ forecasts.
OGJ now forecasts annual US marketed gas production in 2021 will increase slightly from the year-ago level, averaging 99.2 bcfd.
Stable US production and consumption, coupled with high exports, reduced storage levels below the previous 5-year average. Although natural gas stocks were 191 bcf higher than the 5-year (2016–20) average at the start of the year, they were about 94 bcf lower than the 5-year average at the end of June.
About the Author
Conglin Xu
Managing Editor-Economics
Conglin Xu, Managing Editor-Economics, covers worldwide oil and gas market developments and macroeconomic factors, conducts analytical economic and financial research, generates estimates and forecasts, and compiles production and reserves statistics for Oil & Gas Journal. She joined OGJ in 2012 as Senior Economics Editor.
Xu holds a PhD in International Economics from the University of California at Santa Cruz. She was a Short-term Consultant at the World Bank and Summer Intern at the International Monetary Fund.
Laura Bell-Hammer
Statistics Editor
Laura Bell-Hammer is the Statistics Editor for Oil & Gas Journal, where she has led the publication’s global data coverage and analytical reporting for more than three decades. She previously served as OGJ’s Survey Editor and had contributed to Oil & Gas Financial Journal before publication ceased in 2017. Before joining OGJ, she developed her industry foundation at Vintage Petroleum in Tulsa. Laura is a graduate of Oklahoma State University with a Bachelor of Science in Business Administration.
