Economic study examines Middle East gas line to Europe
Europe’s gas import needs are projected to grow dramatically over the next 3 decades.
The International Energy Agency (IEA) has forecast gas consumption in Europe to increase to 900 billion cu m (bcm) in 2030 from 480 bcm in 2000. The main driver for the forecast increase in gas consumption is electric-power generation.
With a slight decline in gas production over that time, Europe’s gas imports are to increase to 625 bcm in 2030 from 180 bcm in 2000.
The largest of the world’s gas reserves are concentrated in two areas near Europe: the Middle East and the Commonwealth of Independent States (CIS). The Middle East has the largest gas reserves in the world, with 72 trillion cu m (tcm) of proven reserves followed by the CIS countries with 58 tcm, according to BP Statistical Review of World Energy, 2004.
The Russian Federation is already Europe’s largest gas supplier through large capacity, long-distance gas pipelines. Gas supplies from the Persian Gulf to Europe will increase considerably in the future; however, at present the Middle East plays only a marginal role in Europe’s gas supply picture, and that is entirely through LNG.
This article presents the results of a technoeconomic study performed by ILF Consulting Engineers, Munich, that estimated the costs of piped gas from the gulf to the European market through a long-distance gas pipeline transiting the Middle East and North Africa.
MENA gas pipeline
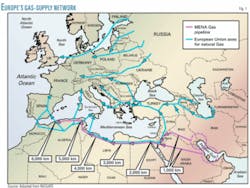
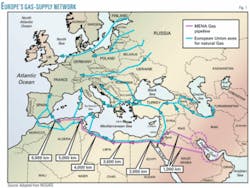
Fig. 1 shows the European gas supply network. In blue is shown the priority axes for gas supply defined by the European Union. Also shown in green are possible routes for the Middle East North Africa (MENA) gas pipeline.
The MENA pipeline would start in the gulf either at the north or middle and pass through both Iraq and Jordan-or through Saudi Arabia-to join the corridor of the proposed East Mediterranean gas ring where the pipeline would run through Egypt, Libya, Tunisia, and Algeria, essentially parallel and close to the shore. The pipeline would then reach the existing and proposed interconnectors to Europe in Libya, Tunisia, and Algeria.
The pipeline from the gulf to the interconnectors would be 4,500-6,000 km and include an allowance of 10% assumed necessary for rerouting.
MENA cost advantages
One important feature of MENA is that some of the usual cost drivers of a long-distance gas pipeline are very favorable. Across the Middle East and North Africa, low-cost labor is readily available, which is very good for such a labor-intensive project. Additionally, the construction areas would have good weather conditions, allowing year-round construction. That would minimize mobilization and demobilization costs and shorten the construction period, which of course lowers the costs of construction.
Other favorable cost factors are the expected low population density of special points and crossings and low costs for the right-of-way. Fig. 2 shows typical terrain of a recent gas pipeline constructed in the Middle East.
Uncomplicated permitting requirements in the region would also add to a low-cost structure and again help minimize construction costs. As for pipeline operating costs, the main factor in long-distance gas pipelines is the energy costs for compressors. Because natural gas to power the compressors is drawn directly from the pipeline, the gas basically is available at production costs, which are quite low in the gulf region.
MENA unit costs
Calculation of the unit gas transportation costs of the MENA gas pipeline considered the specific pipeline cost factors in the region using ILF’s software for the technoeconomic optimization of gas pipelines
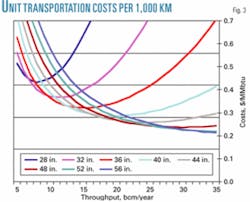
Fig. 3 shows the unit transportation costs for different pipe sizes and for 1,000-km pipeline length. It also shows improvement in economies of scale by increasing the pipe diameter and annual throughput of the pipeline.
The unit transportation costs for different pipe diameters have shown a similar curve. The reasons for this are explained later with regard to the 36-in. pipeline.
Transportation costs are lower as the throughput capacity increases because the large, fixed costs of the pipeline’s initial investment are shared over additional throughputs. The capacity is expanded by increasing compression power and the construction of intermediate compressor stations. The economics of the pipeline benefit from economies of scale.
A minimum unit transportation cost is realized when a certain throughput is achieved, often called the “optimum capacity” point. In the case of the 36-in. pipeline, the optimum capacity is achieved at a throughput capacity of 14 bcm/year with corresponding transportation costs of $0.32/MMbtu.
After that point (optimum capacity), the pipeline becomes inefficient compared to a larger pipe diameter. The U-shaped curve is observed when the extra costs of compressor stations and the fuel gas costs rise exponentially compared to the resulting throughput increase.
Fig. 3 shows how increasing the pipe size displaces the optimum capacity point towards higher throughput capacities and how the optimum capacity means lower unit transportation costs as the pipeline diameter increases. This shows the economies of scale of gas pipelines. The MENA gas pipeline-with a throughput capacity greater than 30 bcm/year-could achieve gas transportation costs/1,000 km as low as $0.22/MMbtu.
The following assumptions were made in calculating the MENA gas pipeline costs:
• 10% internal rate of return on investment.
• 95% pipeline availability.
• 3-year investment period.
• 20-year commercial life.
• $0.55/MMbtu fuel gas costs.
Transportation costs
From the unit transportation costs of the MENA gas pipeline for 1,000 km, the gas transportation cost from the gulf to the interconnectors can be calculated by multiplying the unit costs by the pipeline length (Fig. 1).
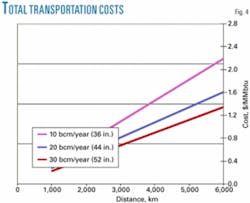
Fig. 4 shows how the transportation costs for the MENA gas pipeline vary with transportation distances and pipeline capacities of 10, 20, and 30 bcm/year. For 10 bcm/year, a 52-in. pipeline would cost $1.70/MMbtu at 4,500 km and $2.20/MMbtu at 6,000 km.
For 30 bcm/year, the same pipeline would cost $1.00/MMbtu for 4,500 km and $1.30/MMbtu at 6,000 km.
Considering that the gas price in Europe in recent years has been far more than $3.00/MMbtu, a large-capacity gas pipeline from the gulf to Europe would be economically viable.
Challenges
Despite the positive aspects of the MENA gas pipeline, the project would face some considerable obstacles. Following are some of the challenges affecting the pipeline costs:
• Heavy up-front investment requirements.
• Cost of capital.
• Pipeline-utilization ratio.
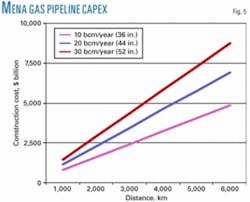
Fig. 5 shows the capital expenditures (capex) for the MENA gas pipeline with throughput capacities of 10, 20, and 30 bcm/year and the investment requirement increases against route length.
The capex of the MENA gas pipeline for 30 bcm/year capacity would be $6.6 billion for 4,500 km and $8.7 billion for 6,000 km. The challenge for financing this amount of capital and the risks involved for such a high investment are obvious and would require multiparty involvement.
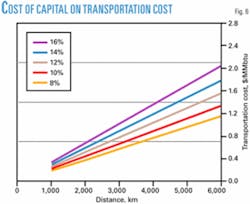
The second main challenge affecting the economics of the pipeline and the gas transportation costs is the cost of capital for construction. The cost of capital is a function of perceived risks by investors and lenders.
Fig. 6 shows the cost of capital on the gas transportation costs on a 52-in. pipeline with a capacity of 30 bcm/year. For a 52-in. pipeline with a capacity of 30 bcm/year, the transportation costs for a 4,500-km pipeline range from $1.00/MMbtu for 10% cost of capital to $1.50/MMbtu for 16% cost of capital.
For a distance of 6,000 km, the transportation costs range from $1.30/MMbtu for 10% cost of capital to 2.00/MMbtu for 16% cost of capital.
Thus, increasing to 16% from 10% the cost of capital, the transportation costs rise about 50%, which could make the project uneconomical, depending on the gas prices in Europe.
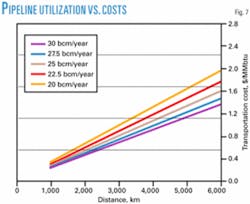
The third main challenge affecting the economics of the pipeline is the pipeline capacity utilization rate. The transportation costs of a gas pipeline are principally determined by the recovery and return on the investment and the fixed operating costs. These costs must be carried regardless of the actual throughput of the pipeline. Thus, the pipeline utilization rate or amount of actual throughput to cover the fixed charges is a key element of the economics of a gas pipeline.
Fig. 7 shows the transportation costs of the MENA gas pipeline with a throughput capacity of 30 bcm/year (52 in.) with different throughput levels or pipeline utilization ratios.
With a pipeline length of 4,500 km, the transportation costs would increase from $1.00/MMbtu if 100% utilized to $1.30/MMbtu if 75% utilized.
With a pipeline length of 6,000 km, the transportation costs would increase from $1.30/MMbtu if 100% utilized to $1.70/MMbtu if 75% utilized. From 100% pipeline utilization down to 75% utilization, the transportation costs increase about 30%, which could make the project uneconomical, depending on the gas prices in Europe.
For large-scale gas pipelines, finding an alignment of interests of all stakeholders that is stable over time is a challenge that usually takes several years to overcome. The first step is proving that the pipeline project is economically viable. ✦
The authors
Ernesto Soria (Ernesto.Soria @muc.ilf.com) is a senior oil and gas consultant at ILF Consulting Engineers, Munich. His focus is on market, economic, and financial advisory work for the oil and gas midstream sector. Soria holds a degree from the University of Saragossa in Spain, where he participated in a year-long exchange program with the University of Glasgow, Scotland, during 1994-95. Soria received an MSc in industrial engineering from Saragossa in 1998. In 2000, Soria received an MBA from the European University in Munich.
John Gray (John.Gray@ muc.ilf.com) for the past 4 years has worked as an oil and gas industry consultant for ILF Consulting Engineers in Munich. Previously, he worked in the civil engineering and environmental sector. Gray received a degree in civil engineering from the University of Hamilton, New Zealand, in 1997 and a Diploma of Business Management from England’s Open University Business School in 2004. He is also completing an MBA at the Open University Business School.
