Accurate fluid characterization, process optimization boosts crude production
A simple procedure accurately characterizes reservoir fluids for designing oil and gas production facilities without significant compromise.
The procedure involves defining a small number of pseudocomponents in order to simplify the design. The characterization also matches the fluid properties reported in pressure-volume-temperature (PVT) analyses such as the reservoir fluid GOR and the liquid and gas density at reported flash conditions.
Once a good match has been achieved, the facility design can proceed with an accurate process simulation and optimization. This procedure avoids start-up and operating problems, boosts oil production, and significantly increases plant revenue as shown by the experience in designing the MLN oil and gas production facilities in Algeria Block 405a, a joint project of Burlington Resources Inc., Talisman Energy Inc., and Sonatrach.
Fluid characterization and process optimization are essential tools for tuning the process design of oil and gas production facilities in order to maximize the financial returns. The enhanced liquid recovery scheme incorporated into the MLN project resulted in a considerable gain in oil production and revenue.
Reservoir fluid composition
A PVT report generally bases the reservoir fluid composition on a chromatographic analysis and includes heavy components up to C30 or higher. Components characterized as C6, C7UC30+ are pseudocomponents representing groups of aliphatic and aromatic isomers whose molecular weights and normal boiling points generally are represented by typical properties compiled from GPA data1 and data compiled by Katz and Firoozabadi.2
Using this characterization in a simulation package such as Aspen Technology Inc.'s HYSYS or Invensys Systems Inc.'s SimSci-Esscor Pro/II is likely to produce significant discrepancies in surface-process-facility models.
In particular, the GOR, the gas molecular weight, and the oil density reported for flash conditions in the PVT report may differ significantly from values predicted by the simulation package. Also, process simulations using all heavy pseudocomponents are unnecessarily cumbersome.
A more practical approach is to reduce the reported 25 pseudocomponents between C6 and C30 to about 8 pseudocomponents or less. Furthermore these same eight pseudocomponents can characterize the heavy ends from a number of different reservoir fluids.
The main objectives of fluid characterization are:
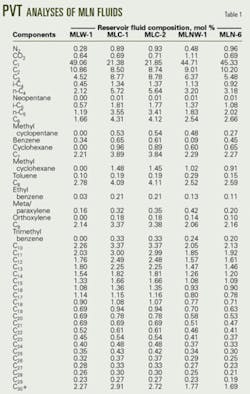
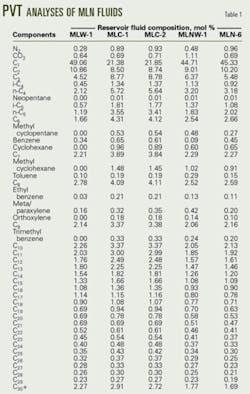
The MLN central processing facilities treat fluids produced by five different reservoirs. Table 1 presents the PVT analyses, which shows that the heaviest component C30+ contributes only about 2 mole % of the fluid, although by weight its contribution is greater than 12%.
Fluid characterization
The design of the MLN facilities used HYSYS software to characterize the fluid. The characterization for each reservoir fluid consists of two parts: light ends and heavy ends. The light ends comprise the components up to C6, including benzene, toluene, and xylene (BTX) components. It is important to determine the distribution of the aromatics in the gas and the liquid phases because they can influence the design and operation of the facilities to meet regulatory emission targets.
The first input step involved entering the heavy-end composition from the PVT reports of each reservoir fluid into the HYSYS program, together with the total molar flow rate. The program's "User Cuts" option is defined, by default, as eight (number of cuts). One may, however, change the number of user cuts depending on the type of fluid in the process simulation. Generally, lighter fluids need fewer heavy-end pseudocomponents to characterize them. HYSYS then automatically generates the pseudocomponents and their properties (Table 2).
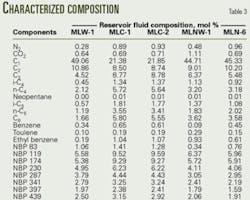
The next step fed the light ends data of each reservoir fluid into the HYSYS program. The program then mixed the both light end and heavy-end streams to derive the composition for each, in terms of the light ends and the pseudocomponents (Table 3).
For simplicity, the process grouped the hexane, methylcyclopentane, and cyclohexane together as a single component hexane with the properties of n-hexane. Strictly the C6 is a pseudocomponent, but for this component the simplification has little impact on the simulated flash results. Similarly, the process grouped ethyl benzene, meta/paraxylene, orthoxylene, and trimethylbenzene together as a single component ethyl benzene. It should be noted that the mole fraction of the light-end components in this derived composition remains identical to that given by the PVT analysis.
The accuracy of the fluid characterization is verified by matching the main parameters of the PVT report with the results derived from the HYSYS simulation3 of the PVT flashes. These parameters include:
Reservoir fluid molecular weight. Because the program converts the heavy components of each individual reservoir fluid to a common pseudocomponents for all reservoir fluids, it is important to check that the molecular weight of the derived composition matches that given by the PVT analysis.
The following tolerances are proposed for the above parameters:
- GOR ±5%
- STO density ±1%
- Gas density ±1%
The GOR and oil density results are the most difficult to match in the simulation. Adjustment of the default values for molecular weight and density of the heaviest pseudocomponent, however, can achieve the tolerances.
Fig. 1 compares the results obtained from the process simulations with those from the PVT analyses. The comparison shows that the simulations define the fluid characteristics within the desired tolerances; and therefore, the process design of the MLN facility can follow with confidence.
MLN process optimization
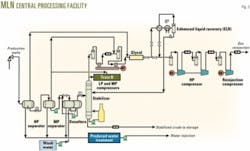
Fig. 2 shows the simplified flow scheme for the MLN central processing facilities (CPF).
The high-pressure (HP) separator receives fluid from the gathering system and normally operates at 40 bara. The crude oil, with about 5% water then goes to the medium pressure (MP) separator, while the gas goes to the glycol unit. The MP separator operates at 14 bara and, besides treating the crude oil coming from the HP separator, can treat any rerun off-spec crude from the off-spec storage. The crude leaving this separator contains about 2% water and is pumped to the desalting unit.
The stabilizer column stabilizes the crude and operates at 8 bara. The hydrocarbon liquid recovered in the enhanced liquid recovery (ELR) section serves as reflux in the stabilizer and augments the recovery of stabilized crude. Forced-draft air coolers cool the stabilized crude before the crude enters the floating-roof storage tanks. Eventually, motor-driven centrifugal pumps transfer the crude at about 73 bara for export through a 16-in. pipeline.
The low-pressure (LP) reciprocating compressor compresses the flash gas leaving the stabilizer column to about 14 bara. A forced-draft air-cooler lowers the temperature of the compressed flash gas before the flash gas mixes with the gas from the MP separator. The MP compressor compresses the mixed gas to about 40 bara. This gas mixes with the gas from the HP separator and then goes to the dehydration unit where contact with triethylene glycol dries the gas.
The dried gas goes to the ELR section for recovering hydrocarbon liquid for the stabilizer column reflux. The HP compressor and then the reinjection compressor successively compress the gas to about 400 bara for injection into wells.
The produced water from the three-phase separators, plus condensed water from the stabilizer water-pot and wash water from the desalting unit goes to the water treatment unit. This unit consists of a tilted-plate separator followed by an induced gas flotation (IGF) unit. The treated water goes to storage and, after filtering, pumps inject the water at about 200 bara into a disposal well.
The front-end engineering design (FEED) and the basis engineering phases required various process optimization studies. The results of some of these studies follow.
Single stage vs.
two-stage desalter unit
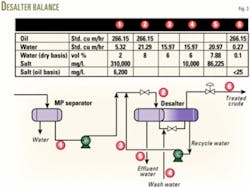
In the Berkine region, operators often co-produce the oil reserves with a supersaturated brine. Desalting, therefore, becomes necessary because the treated crude has a 40-ppm maximum salt specification. A shallow aquifer, containing about 10,000-ppm salt, conveniently provides water for washing the crude.
During the FEED, the design considered the MP separator as a first-stage desalter, and the crude was then directed to a single-stage desalter unit equipped with a flash drum on top. The study carried out in collaboration with the vendor of the desalter unit, however, concluded that this scheme would not achieve the required specification. Furthermore, the flashing of crude in the desalter might have an adverse effect.
The final design, therefore, selected a two-stage desalter unit. Fig. 3 shows the salt balance for the unit.
Stabilizer column optimization
The stabilizer column is at the heart of the process for achieving the required crude oil specification. The stabilizer column operates at 8 bara with temperatures of 20° C. at the top and 170° C. at the bottom. The feed comes from the two-stage desalter, and the column has a direct-fired reboiler.
The ELR section provides the reflux to the column. This uses an external propane cycle to condense partially the dry gas coming from the glycol contactor at 40 bara. The column can operate without reflux, in which case it acts as a simple stripping column with the fired reboiler providing the stripping vapor from the feed. The operation with reflux, however, enhances the recovery of stabilized crude.
The design optimized the column with respect to feed tray location and water distribution in the column.
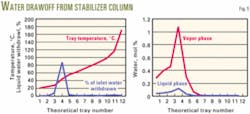
For the simulations, the liquid recycle from the ELR was fed to the top tray, while the feed from the desalter entered on various trays below the top tray (Fig. 4) As a result of these simulations, the design selected Tray 4 as the feed tray because this results in minimum reboiler duty and minimum compressor power consumption, while not significantly curtailing oil production.
The feed to the stabilizer column contains up to 0.2% by volume of salty water, and accumulation of this water within the column is a major design problem. This accumulation occurs because the water vapor pressure is too high for liquid phase water to be included in the bottom product, and the boiling point is too high for vapor phase water to be carried over with the overhead product.
Accumulated water will eventually dump from the trays and enter the reboiler circuit where it could cause corrosion. Scale and salt deposits from the water could also foul the reboiler tubes. The maximum amount of water, therefore, must be removed before the fluid enters the bottom zone of the column.
Some alternatives for water removal are:
This process requires large electrostatic coalescing equipment to remove the water at an additional estimated cost of more than $1 million. This solution was therefore discarded.
This process requires the addition of a column condenser, a reflux drum, and reflux pumps and, because the higher top temperature generates more vapor, a larger reflux condenser and reboiler. Furthermore, the higher vapor flow rate increases the power consumption of the flash-gas compressors.
It was recognized that the additional investment and operating costs would not be economical, and this scheme was therefore discarded.
A detailed process study investigated water build-up in the column. The HYSYS simulations specified liquid withdrawal from each tray (Fig. 5) together with the temperature profile up the column.
The water and liquid hydrocarbon are drawn off to a pot in which the water level is controlled by a level-control valve that spills the water from the bottom of the pot. The hydrocarbon condensate is then returned to the down comer below the draw-off tray.
The whole circuit operates on the density difference between the fluid in the descending pipe and that in the return pipe. The detailed design, therefore, must pay careful attention to the location of the water draw-off pot and to the piping layout.
Enhanced liquid recovery
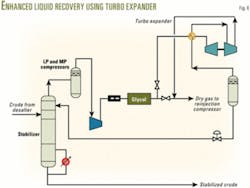
The design conceived the ELR section as a way to augment oil production. The LP compressor compresses the overhead vapor leaving the stabilizer column at 8 bara to about 15 bara. The gas mixes with the gas coming from the MP separator. The MP compressor then compresses this combined gas stream to 40 bara.
This gas mixes with vapor coming from the HP separator before entering the glycol drying unit. The ELR section is downstream of the glycol contactor. The design included studying the following process alternatives:
Alternatively, a Joule-Thomson valve may replace the turboexpander. The JT valve could be located immediately downstream of the glycol dryer, or at a higher pressure such as downstream of the first stage of the HP compressor. The process simulations show, however, that the former location results in a liquid recovery that is insufficient for the column reflux.
Ultimately the design discarded both turboexpander and JT valve schemes because the low temperature of the recovered liquid could form ice and hydrates and also because of the requirements for special construction material.
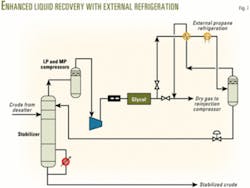
External refrigeration scheme (Fig. 7). In this scheme, a heat exchanger cools the dry gas from the glycol unit. Then an external propane refrigerator chills the gas before the resulting gas-liquid mixture enters a separator. The separated liquid expands through a level control valve before entering the top of the stabilizer as recycled reflux.
The low-temperature gas from the separator serves to pre-cool the dry gas entering the propane chiller. In this scheme, the liquid forms at higher pressure and temperature. Consequently, the liquid flash is more effective, providing more reflux to the column.
Furthermore, hydrocarbon recoveries are high, more than 98% for pentanes and 99% for hexanes plus. This analysis considered this to be most cost-effective and therefore selected it for the final process.
A lower chill temperature increases oil recovery, within the constraints of the Reid vapor pressure specification, but at the cost of higher refrigeration compressor power and capital expenditure. Fig. 8 shows the influence of reducing the chill temperature. Oil recovery increases steadily until the chill temperature reaches –7° C.; after this point further oil recovery is marginal (Fig. 8a).
The column reboiler duty increases moderately until the chill recycle temperature reaches 2° C.; after this point the reboiler duty increases rapidly (Fig. 8b). Compressor power consumption follows the same trend, except that at chill temperatures below 2° C. the power consumption increases exponentially (Fig. 8c). The influence on the refrigeration duty below 2° C. is even more dramatic (Fig. 8d).
The estimated installed costs for lower chill temperatures are significantly higher than for more moderate chill temperatures and, in the end, the design used a moderate chill temperature of 2° C. for the final process. This gives an oil recovery that is not far short of the maximum possible, and whose corresponding recycle requirement does not add excessive load on the compressors and reboiler.
The design should consider carefully the possibility of hydrate formation. A study based on the 2° C. chill temperature identified two critical zones: the top of the stabilizer column where the cold liquid meets the wet vapors from the column feed and the cold liquid itself.
Hydrates will preferentially form in the vapor phase when free water is present. The glycol unit dries the gas feed to the ELR to a dew point of –5° C. At this temperature hydrates in the liquid are unstable, but in the gas phase the hydrates will form on cold surfaces whenever they have enough time to do so.
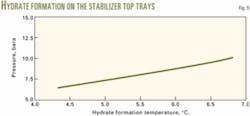
Fig. 9 shows that hydrates will start forming at the top of the column at temperatures below 6° C., with the column pressure at 8 bara. During winter operation, the stabilizer column feed enters at about 25° C., before mixing with the recycled cold liquid. The column top temperature is greater than 20° C., so that hydrate formation on the top tray is not a problem. To avoid any risk of hydrate formation in the recycled cold liquid, the process must maintain the fluid downstream of the control valve at a high enough velocity.
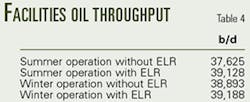
The enhanced liquid recovery equipment produces more than 300,000 bbl/year of additional oil (Table 4). This increases the yearly plant revenue by more than $8 million, based on a crude price of $25/bbl.
Acknowledgment
The authors acknowledge the management of Burlington Resources, Talisman Energy, and Sonatrach for permission to publish this article.
The authors also thank Jean-Michel Corbic and Patrick Job for the process optimization studies and Virna Sikorski and Abderrahmane Halouane for completing tedious fluid characterizations calculations.
References
1.GPA Table of Physical Constants of Paraffin Hydrocarbons and Other Components of Natural Gas, GPA 2145-96.
2.Katz, D.L., and Firoozabadi, A., "Predicting Phase Behaviour of Condensate/Crude Oil Systems Using Methane Interaction Coefficients," JPT, November 1978, pp. 1649-1655
3.Dharmadhikari, S., "PVT data useful for design of oil production facilities," OGJ, May 22, 1995, pp. 53-56.
The authors
Shashi Dharmadhikari (shashikan.dharmadhikari @litwin.fr) is responsible for upstream and gas processing technology for Litwin, France. He has more than 30 years' experience in process design and plant operations. Dharmadhikari holds a PhD in chemical engineering from the University of Surrey, England, and the BS from the Bombay University, India. He is a fellow member of the Institution of Chemical Engineers, UK, and a member of AIChE.
Tony Bretherton ([email protected]) is facilities engineer for Burlington Resources Inc., London. He previously was with Air Products and Badger in the UK. Since 1978 he has worked as an engineering consultant in the UK oil and gas industry, both onshore and offshore, and more recently in oil and gas development in North Africa. Bretherton has a PhD in chemical engineering from Bradford University in England. He is a Member of the Institute of Chemical Engineers and a Chartered Engineer in the UK.
