Method helps find hydrocarbon areas, aids optimum seismic survey planning
Most E&P companies have turned to seismic surveys to map rock structure in an attempt to select the optimum position for a drill site, especially in offshore exploration. Even with the use of 3D data, dry holes frequently occur, and the presence of hydrocarbons at depth can only be proven by use of the drill bit.
Much time and effort are spent on seismic surveys over regions that have little probability for oil and gas discovery. Placing seismic surveys above future oil and gas field areas rather than over barren areas saves large amounts of exploration resources and is highly desirable.
An airborne method exists for locating hydrocarbon reservoir areas that does not depend on whether the reservoir is a structural or stratigraphic trap, onshore or offshore.
The method is based on surface detection of magnetic field effects that result from anomalous increases in magnetic properties of certain semi-shallow rock strata above the reservoir area. The magnetic properties of these strata beyond the reservoir area are not altered.
Rapid advancement of an exploration program is made possible by analysis of airborne magnetic data. Results indicate only the hydrocarbon reservoir area and not depth to oil or gas.
MS method
Verifications of this airborne method are demonstrated by comparing magnetic susceptibility (MS) measurements from oil and gas well cuttings with those from dry holes.1-5
Several thousand well and dry hole cuttings MS measurements have been compared from regions in the US and from various continents, all showing the same result.
The flux density of the magnetic field along the earth’s surface varies with changes in rock magnetic properties and depth to magnetic material. The larger the magnetic mineral mass and MS intensity of the anomalous magnetic material, the greater is the increase in density of magnetic field lines of force at the surface, the flux density.
The product of the Magnetic Susceptibility (MS) x altered Rock Interval (RI), the MSRI, when spread laterally to the extent of the magnetic mineral mass, approximates the region of flux density increase in the magnetic field lines of force. Semishallow magnetic mineral masses create detectable small changes in the magnetic field flux density that can be measured by high-sensitivity airborne magnetometers.
Removal of that part of the composite magnetic field caused by (1) basement rocks and corrections for (2) diurnal magnetic field changes and (3) aircraft altitude changes gives the patented Sedimentary Residual Magnetic (SRM) field. Survey line-to-line clustering of SRM anomalies creates the patented Magnetic Bright Spot (MBS). The MBS defines the extent and intensity of an authigenic magnetic mineral anomaly. Local increases in the magnetic field correlate with MSRI values created as a result of microleakage.
Alabama MSRI
The State of Alabama required from 1947-2005 that drill cutting samples at 30-ft intervals from surface to TD be stored in the Geological Survey of Alabama sample library.
The GSA sample library, because of its wealth of shallow samples, permits MS evaluation of early exploration wells that were possibly not drilled sufficiently deep or were improperly evaluated. MSRI values have been determined for the 143 exploration drill holes.
In southern Alabama the Selma chalk is the principal MS-altered formation, although more shallow MS-altered carbonates have been found. Samples from many producing wells have been measured to TD, and MS anomalies have not been found deeper than in the Selma chalk.
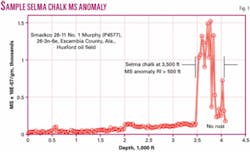
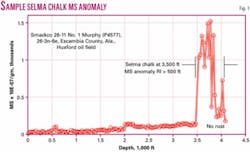
In the rectangular measurement region bounded by 6n-5e to 1n-16e, the top of the Selma chalk varied in depth from 2,300 to 3,600 ft. Fig. 1 shows an example of a Selma chalk MS anomaly with the MS-altered rock interval greater than 500 ft.
The authigenic magnetic mineral responsible for the MS anomaly in the Selma chalk is maghemite, γFe2O3, and maghemite has been the magnetic mineral in most onshore analyses. The offshore magnetic mineral has been analyzed to be greigite, Fe3O4. Magnetic minerals have been identified by the Mossbauer effect technique.6
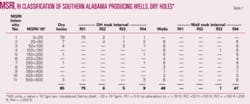
MSRI is classified into 11 intensity intervals (Table 1). The MS-altered rock interval, RI, is separated into four depth groups.
MSRI is shown for the 95 dry holes, 79 of which MSRI Intensity Number = 1. All drill holes having the Intensity Number >4 should be evaluated, especially those having Intensity Number of 11 with RI4.
Fig. 2 is a display of Table 1 and shows distribution of wells and dry holes as a function of MSRI intensity number and MS altered rock interval.
Table 1 demonstrates the association of hydrocarbons at depth with MS anomalies and the lack of MS anomalies with the lack of hydrocarbons. It demonstrates and justifies the use of the MBS to seek out, by use of airborne sensors, those areas having local flux density concentrations.
Offshore MBS examples
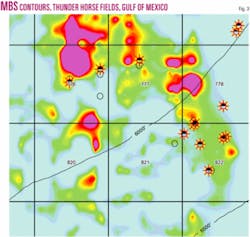
The Thunder Horse fields, Mississippi Canyon area, Gulf of Mexico, present an example of the use of the MBS method in 6,000 ft of water (Fig. 3).
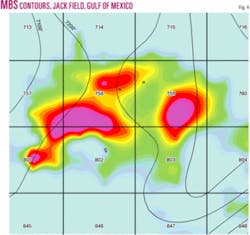
Data have recently been analyzed to evaluate SRM anomaly detection in 7,200 ft of water in the newly discovered Jack field area, Walker Ridge blocks 758-759, Gulf of Mexico. Fig. 4 presents the MBS developed in the Jack field area.
The Jack field MBS anomaly covers more than 40 sq miles and is the largest MBS discovered in the Gulf of Mexico. Data are intensity-normalized to a water depth of 4,000 ft and position-corrected for the inclination angle of the earth’s magnetic field.
The advantages
If exploration oil and gas well drill cuttings are accurately captured, saved, and measured for MSRI, a prediction as to the success or failure at TD can be made.
If no MS anomaly results from accurate sample capture and subsequent measurement at the time of drilling, a decision can be made to terminate the drilling operation and select a new drill site.
In any new area, a sample library search should be made to locate previously drilled oil or gas wells having shallow cuttings. Such cuttings MS measurements will provide (1) anomalous sample MS or lack thereof, (2) surface depth to the altered strata, (3) RI thickness of the MS-altered strata, and (4) MSRI intensity.
The use of the MBS to evaluate a prospective area, onshore and offshore, should precede seismic surveys to eliminate those areas not prospective and define those that are. More than 95% of most areas surveyed will not have an MBS.
Based on the results of the Jack field study, offshore surveys using the cesium vapor magnetometer to detect hydrocarbon prospective areas in 7,000 ft of water are possible where salt thickness variations, such as salt domes and rapidly thinning and thickening salt lenses along a flight line, do not interfere with anomalous SRM detection.
Acknowledgments
The use of Airmag Surveys Inc.’s Thunder Horse area data, of Fugro Airborne Surveys’ Jack area data, cooperation of the Geological Survey of Alabama and Lewis Dean, financial assistance supplied by Cs Solutions regarding the Gulf of Mexico data analysis, and the effort given by Nathan Frick and Michael Foote are appreciated.
References
- “Aeromagnetic Field Data Analysis/Rock Magnetic Susceptibility, A Method for Locating Oil & Gas Reservoirs,” ISEM/SMU Research Conference of Vertical Hydrocarbon Migration, Fort Burgin, NM, Oct. 17, 1987.
- “Correlation of Borehole Rock Magnetic Properties with Oil and Gas Producing Areas,” APGE Bull., Vol. 3, No. 1, 1988, pp. 114-134.
- “Use of Magnetic Field aids Oil Search,” OGJ, May 4, 1992, pp. 137-141.
- “Relationship of Near-Surface Magnetic Anomalies to Oil and Gas Producing Areas,” AAPG Hedberg Research Conference on Near-Surface Expressions of Hydrocarbon Migration, Apr. 24-28, 1994, Vancouver, BC.
- Foote, R.S., Nowak, R., and Sobehrad, J., “Aeromagnetic Near-Surface Profiling as an Exploration Tool,” Application of Emerging Technologies, Fifth in the ISEM Unconventional Methods in Exploration Series, Southern Methodist University, Oct. 11, 1997.
- Mossbauer technique analysis, Dr. Gary Long, University of Missouri-Rolla.
The author
Robert S. Foote Sr. is owner of Geoscience & Technology Inc. For more than 20 years, he has developed and subsequently patented SRM technology. Before originating the method, he worked with Texas Instruments’ central research laboratory and with Geodata International. He was responsible for operations directed toward oil, gas, and mineral exploration. He has a BS and MS in physics from the University of Illinois.
