Declining costs enhance Duvernay shale economics
Barry Rodgers
Rodgers Oil & Gas Consulting
Edmonton
Alberta's Duvernay play is often characterized as Canada's Eagle Ford and is similarly seen as one of the most economically attractive plays in North America.
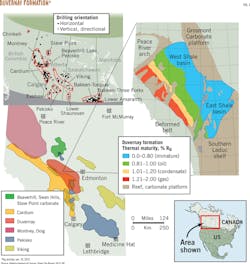
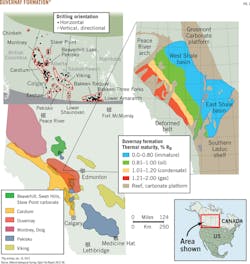
The play lies east of Edmonton and trends southeast to northwest-southwest to northeast in terms of the gas-oil window (Fig. 1). Like the Eagle Ford, the Duvernay contains three resource windows including oil, condensate, and dry gas. Well depths are 2,500-4,000 m.
Duvernay operators are still in the research phase of determining the best drilling locations and the most productive well completion practices for maximum liquids recovery. This approach is not unique and is characteristic of all unconventional resource play developments.
Whereas conventional plays in new areas experience higher costs resulting from the likelihood of a dry hole, unconventional resource plays however do not face the same exploration risks. Unconventional plays do face relatively high upfront costs due to the need to drill a number of wells in order to understand the optimal drilling and completion practices.
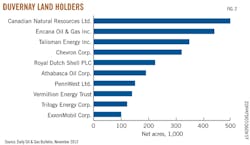
This report assesses the current well economics for the Duvernay, based on published reports and company presentations describing expected resource recoveries and costs. Fig. 2 summarizes major operators working in the region.
Recoverable reserves
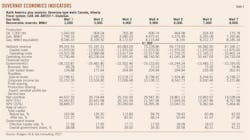
To date, the Alberta Geological Survey and Alberta Energy Regulator on Duvernay have yet to release recoverable reserves estimates for the play. A variety of individual company reports, however, do contain these estimates on an individual well basis (Table 1).
A summary review of this information shows that condensate liquids GORs have an inverse relationship with gas estimated ultimate recovery (EUR). Some operators report condensate-natural gas ratios to 700 bbl/MMcf with others reporting higher values.
Well costs
Operators report drilling and completion costs of $8.3-13.8 million/well with most estimates averaging $10.8 million/well (CND 12 million). Although high, these costs are in line with comparable North American plays at similar stages of development.
As knowledge is obtained, costs typically decrease. Economies of scale also develop as operating companies advance from single exploration and appraisal wells to the factory approach that uses pad-drilling configurations. One operator estimates that well costs will fall by 20-30% by 2015.
With the Eagle Ford as an example, drilling and completion costs decreased to $8 million in 2012 from $14 million in 2010. In some cases, companies have reported a per-well cost of less than $6 million in the Eagle Ford.
Considering publically reported data related to capital expenditures (capex) for oil and gas wells requires caution as these costs can refer to half-cycle or full-cycle expenses. Half cycle typically includes costs for drilling and completion only.
This article focuses on full-cycle capex, which are often associated with an entire play. Additional costs can include:
• Land acquisition.
• Seismic acquisition and processing.
• Well tie-in.
• Roads, bridges, field offices, warehouses.
• Building batteries, plants, and facilities.
• Central treating and testing facilities.
The cost of central treating and testing often can equal drilling costs in some circumstances.
For economic purposes, full-cycle costs often are taken into account on a project basis, but the total cost can be divided and included as per-well cost. Group gathering pipelines and sales pipelines would be treated as central facilities. Processing and treating costs can either be capitalized or leased as an operating expense. The data presented in this article incorporate processing as an operating cost (opex).
Despite the current higher cost, reductions similar to those in North America should be expected for the Duvernay and other Canadian plays.
Operating expense
There are no universal opex cost templates or standard categories. Each company devises its own. Some companies use many categories because they want to track more detailed information. Other companies aggregate many expenses into fewer categories with outlays attributed to "Other" or "Miscellaneous," which can be set as a variable or fixed category. As an example, "road maintenance" can be considered a fixed or variable opex.
Opex can include the following:
• Labor, taxes, lease rentals.
• Repairs and maintenance.
• Equipment rental, trucking.
• Utilities, supplies, and chemicals.
• Custom processing.
Items such as major overhauls and plant turnarounds, which are typically carried out every 3 years, can be included as opex or capex. Many operators capitalize these expenses when the processes are done less frequently that every 2 years.
Opex and capex also are used as a trade off in many situations. For example, equipment can be rented (opex) or purchased (capex). For wells that are not tied to central treating, oil hauling expenses can be interchangeable between opex and capex.
Operators also will use an "other" category to account for marginal, infrequent expenses such as weed control, spill cleanups, consultant visits, corrosion monitoring, painting, and others.
Publically available cost information can be obscure, particularly for operating costs. Given the associated commercial sensitivities and competition involved, these anomalies are understandable.
Current information for the Duvernay play shows opex at $1(US)/Mcf and $5/bbl for gas and oil, respectively. Other cost structures include a fixed component of $2,500-5,000/month.
Compared with Eagle Ford opex ($5,000/month plus $1.50/bbl), the Duvernay is modeled at $2,500/month plus $1.75-1.15/Mcfe (Table 1).1 Gas transportation and processing costs are set at $1/Mcf with a liquids cost of $2.50/bbl.
These models assume a gas price of $5.50/Mcf. Long-term oil price is modeled at WTI $90/bbl. Even though condensate is often discounted to WTI, local market conditions can yield a condensate price premium. Notwithstanding the current condensate price premium in Alberta due to high demand from oil sands producers, this analysis models the condensate price to be at par with the crude oil price.
The fiscal terms applicable to the Duvernay depend on whether the well produces oil or gas. Analysis for this report assumes that the wells are classified as gas. Even though the wells are classified as gas, the condensate volumes are subject to Alberta's oil fiscal terms.2
Return on investment
For Duvernay gas wells, the rate of return (ROR) is inversely related to EUR-as recoverable reserves increase by 2-8 bcf, the ROR decreases to 27.66% from 121.22% (Table 2). This is entirely attributed to the declining liquids content, more specifically to the free condensate volumes.
Operators consistently report EURs of 4-6 bcf. The RORs are shown to be attractive, at 78%-114% on a before-tax basis and 55%-83% on an after-tax basis. The effective royalty rate is about 18%, with the overall government share at 40%. Investor net cash flow is $25-$35 million/well.
Liquids analysis
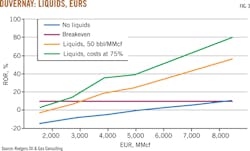
Liquids content is critically important to gas well economics. Fig. 3 shows (red line) the ROR for each well producing no liquids. The minimum EUR is 8 bcf at expected long-term gas prices of $5.50/Mcf and current well costs of CND 12 million.
Realizing 50 bbl of liquids/MMcf (green line) dramatically reduces the per-well breakeven gas reserves to less than 4 bcf from 8 bcf and increases the high EUR case after tax ROR to 55.6% from 10.5%.
A 25% improvement in well costs would increase the high case after tax return to 80% and reduce the breakeven reserves size to 2.5 bcf.
Cost analysis
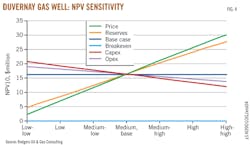
In spite of the importance of liquids content and attractive Duvernay economics, drilling and completion costs are still considered high. Fig. 4 presents a sensitivity analysis for the Well No. 4 case (5 bcf with GOR = 100) within ±45% for EUR, price, capex, and opex.
The reserves (EUR) sensitivity is highlighted. The low-low (-45% reduction) case for EUR indicates that, even with EUR reduced to 2.75 bcf from 5 bcf, the investor net present value discounted at 10% (NPV10) is still $5 million/well. Similarly, a 45% reduction in well costs to those comparable with Eagle Ford would improve the investor NPV10 by more than 26% (to $20.7 million/well from $16.4 million/well).
An important factor when considering costs in the context of Alberta is the Deep Gas Royalty Credit Program (DGRCP). This program is based on a policy that recognizes deeper wells as more costly to drill and complete. Based on the TVD and TMD, the reference case well could receive a $6.5 million credit. Depending on the well's economic attractiveness, the full value of the credit may not be realized. This results from the royalty formula's minimum 5% rate and the program's maximum 60-month term.
Because of the program's structure, the value of the royalty credit decreases with decreasing economic attractiveness, ranging to $1.9 million for the 8-bcf dry gas well with no condensate and an NPV10 of $4.5 million from $6.0 million for the 2-bcf well with a free GOR of 500 bbl/MMcf and an NPV10 of $25.6 million. For the reference case 5,000-bcf well, the DGRCP increases the investor after-tax ROR to 68% from 62%, reflecting a credit value of $4.7 million.
Fiscal components such as the DGRCP help account for the fiscal cost advantage enjoyed by operators in the Duvernay when compared with that experienced by operators in the Eagle Ford. Declining drilling and completion costs and lower royalty costs provide attractive economics and improved competition within the Duvernay play.
References
1. Bain, Ronald A., "Estimated Future Reserves and Revenues-East Pearsall Project, Frio County, Texas," Eagle Ford Oil and Gas Corp., September 2012.
2. Thumbnail Descriptions and Economic Summaries, "Part II of North America Oil & Gas Economics and Fiscal Intelligence Service (NAEFIS)," Rodgers Oil & Gas Consulting.
The author
Barry Rodgers ([email protected]) formed Rodgers Oil & Gas Consulting in 2010. With more than 30 years of experience both in the public and private sectors, Barry specializes in upstream oil and gas economics analysis and fiscal systems design and evaluation. Rodgers is a graduate with a degree in economics of Memorial University of Newfoundland, St. Johns.
