Enhanced oil recovery (EOR) in unconventional reservoirs has been stymied by its low-permeability, low-porosity environment. Liberty Resources performed water-alternating-gas (WAG) EOR pilot tests in the Bakken. The test well produced 24% more than expected without injection for 120 days.
Researchers at Texas A&M University, Third Wave Production LLC, and Auterra Operating LLC analyzed surfactant injection in two Eagle Ford (EF) shale wells. The first well demonstrated significant oil uplift, but diversion did not produce a clearly identifiable uplift improvement beyond surfactant alone.
Following these pilots, researchers at Texas A&M produced a workflow for evaluating unconventional surfactant EOR treatments. The model showed several scenarios for improving EF surfactant treatments. Simulation constraints ensured that these scenarios depict practical field operations with respect to pumping requirements and surfactant availability.
Unconventional EOR pilots
Unconventional wells experience high decline in their first year and gradual but persistent decline in subsequent years, achieving only about 10% ultimate recovery. Attempts to extract additional oil from depleted unconventional wells include steam and CO2 huff ‘n’ puff, water injection, and surfactant injection (OGJ, Jul. 4, 2022, pp. 48-52, OGJ Online, May 21, 2024). Steam and CO2 injections suffer from poor sweep and premature breakthrough, and oil-wet reservoirs limit water flood effectiveness by preventing spontaneous water imbibition into the fractures to displace residual oil. The latter is addressed by incorporating (WAG) and surfactants into the EOR program to increase reservoir contact and oil mobility (OGJ, Jan. 4, 2021, pp. 39-42).
Bakken WAG injection
Liberty Resources LLC performed WAG EOR pilot tests in Williston basin. Wells decline more than 70% in the first year and an additional 50% in the following 2 years in the unconventional Bakken petroleum system (BPS). Production gradually stabilized but overall recovery remained below 10%. Small-scale WAG EOR pilot tests used rich gas injection at the Stomping Horse development area and WAG with surfactant at the East Nesson site in Mountrail County, ND.
WAG injection increases reservoir pressure above minimum miscibility pressure (MMP) to mix reservoir oil and injected gas. Surfactants alter reservoir rock wettability and reduce interfacial surface tension between oil and water, decreasing capillary pressure and mobilizing fluids out of the fractures. The East Nesson WAG pilot successfully produced incremental oil, leading to a second East Nesson pilot program in East Tioga field of Mountrail County.
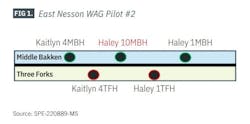
The site contains five horizontal wells with horizontal sections of about 10,000 ft in Middle Bakken and Three Forks formations on a 2,560-acre drill-spacing unit (DSU) consisting of Kaitlyn and Haley 1,280-acre DSUs.
The expanded objectives of the second pilot included improving operations and maintaining offset performance. The former focused on economically sourcing equipment, produced water, and produced gas for routine WAG injection, and the latter monitored injection effects on nearby well production.
Operations included an existing downhole jet-pump to inject produced water and a company-owned compressor for injecting produced gas. Water and gas were drawn from existing produced water and gas gathering systems and were injected down the tubing.
The second pilot positioned the Haley-10MBH injection well between Kaitlyn 3MBH (33497) and Haley 1MBH (33498) boundary wells and above Kaitlyn 4TFH (35882) and Haley 1TFH (35884) monitoring wells (Fig. 1). Boundary wells minimize outflow of injected fluids from the DSU.
An initial injection scheme optimized from a calibrated simulation model used five injection cycles. Injected volumes were based on operational and practical constraints. The model predicted cumulative 7,500-bbl incremental oil recovery for 3 years after injection compared with production without EOR. Predicted gross gas utility factor (GUF), the volume of gas required per barrel of incremental oil, was an efficient 12 Mscf/bbl.
The actual pilot injection program performed a 3-cycle scheme but used similar water and gas volumes to the simulated 5-cycle scheme. Although surfactant tests showed significant alterations in reservoir wettability, and the simulation model predicted significant oil recovery with surfactant, the pilot was simplified to exclude surfactant and only focus on the water and gas components of injection.
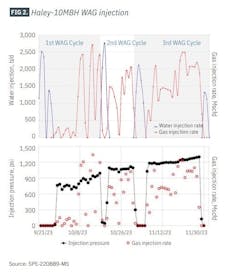
WAG injection began Sept. 22, 2023, about 2 years after the first East Nesson pilot. The first WAG cycle began by injecting locally sourced produced water at an average of 1,400 b/d for 6 days while monitoring injection pressure. Produced gas injection followed at 0.9 MMscfd for 20 days while monitoring injection pressure and offset production well gas-to-oil ratio (GOR). A compressor problem limited injection rates below the 3-MMscf injection rate target for the duration of pilot injection. Injection under these lower rates did not experience any problems, and maximum wellhead injection pressure was <50 psig during water injection and 1,303 psig during gas injection.
The second WAG cycle injected produced water at an average of 1,900 b/d for 3 days followed by produced gas injection at an average of 1.4 MMscfd for 11 days. A third WAG cycle injected water at about 1,500 b/d followed by gas at about 1.6 MMscfd for 24 days. The cycle concluded with 2 days of water injection totaling 2,400 bbl. Haley-1TFH experienced gas breakthrough during this cycle, leading to well shut-in to control and manage the increasing gas production rate.
Injection finished on Nov. 30, 2023. Overall, about 23,000 bbl of water and 70 MMscf of gas were injected into Haley-10MBH (Fig. 2). Neither gas nor water broke outside the DSU pilot area.
During injection, production continued at the four monitoring and boundary wells with continuous production monitoring. After WAG cycling, Haley-10MBH returned to production, and GOR and water cut were monitored from all wells in the pilot for gas breakthrough and produced water flowback efficiency.
East Nesson WAG Pilot #2 EOR
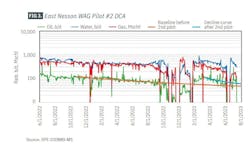
After injection, the Haley-10MBH injection well flowed back 36% of injected gas and 126% of injected water volume which stabilized at about 83% water cut. This water cut was like the pre-pilot water cut. Post-injection average oil rates were 28 b/d (30-day average), 40 b/d (60-day average), 43 b/d (90-day average), and 41 b/d (120-day average) compared with the pre-pilot 31 b/d (30 day) average. Initial gas and water flush-back limited estimated incremental oil production to about 10% (30-day average), but it turned to a positive 25% during the 60-day average and increased to 34% for the 90-day average. The 120-day average declined to 24% incremental recovery, but overall, injection in Haley-10MBH was effective.
The Haley-1TFH monitoring well was shut in to contain injected gas after the GOR increased during the third injection cycle. Initial 30-, 60-, 90-, and 120-day average oil production rates after injection were 26, 28, 29, and 29 b/d, respectively, compared with 21 b/d before injection. Oil rates increased 24% (30-day average), 33% (60-day average), 32% (90-day average), and 32% (120-day average), indicating a positive effect from injection into Haley-10MBH. Operational issues resulted in prolonged shut in of the Kaitlyn-4TFH monitoring well, and results from nearby WAG injection were inconclusive.
Kaitlyn-4MBH and Haley-1MBH boundary wells showed a slight increase in oil production during WAG injection and after a prolonged shut in due to weather and nearby fracture stimulation operations post-injection, but the bump in production was short lived and the wells did not experience significant uplift from nearby injection.
Overall, incremental oil production indicates that the WAG injection was effective for the East Nesson pilot site. Post-injection modeling predicts about 3,900-bbl incremental production after 3 years, about half of what the initial modelling predicted. Actual injected volumes and cycles, however, were lower than the initial modelling assumptions. Regardless, the WAG scheme was considered a success, with an 18 Mscf/bbl GUF.
Decline curve analysis (DCA) confirmed the post-injection modelling results, estimating about 4,400 bbls of incremental oil with 87% of the uplift coming from the Haley-10MBH (injection) and Haley-1TFH (monitoring) wells.
Further development of WAG EOR in the Bakken includes adding surfactants to the water cycles, replacing field gas with CO2, and injecting into multiple wells within the DSU.
Eagle Ford surfactant huff 'n' puff
Researchers at Texas A&M University, Third Wave Production LLC, and Auterra Operating LLC studied the impact of surfactants and diverters for EOR in EF shale. Wells EF-1 and EF-2 were chosen for analysis based on similarity in location, construction, and age. The bullheaded EF-1 surfactant treatment had no control over injected interval, while EF-2 included polylactic acid (PLA) as a diverter to improve injection conformance. Both wells were stimulated at pressures less than initial fracture pressure.
Both wells targeted the Upper Eagle Ford Strata and were drilled and completed in 2012-13. EF-1 spans 7,000-7,300 ft TVD across the lateral and lies about 1 mile down-dip from EF-2 which spans 6,700-7,000 ft across the lateral. The wells follow the strata with a toe-down trajectory.
EF-1 properties include 210° F. bottomhole temperature (BHT), 26° API oil gravity, and 8.8 wt % total dissolved solids (TDS) concentration. EF-2 properties are slightly cooler and thicker, with 200° F. BHT and 24° API oil gravity. Brine TDS is 7.9 wt %. Both wells have similar formation mineral compositions and produce low gas oil ratios (GOR) and high water-cuts.
The wells also have similar completions. EF-1 lateral extends to 5,450 ft and contains 25 stages. EF-2 is shorter with a 4,750 ft lateral containing 24 stages. Stage fracture treatments were identical using about 2,500 bbl of gel-slickwater hybrid fluid, 160,000 lb of 20-40 mesh proppant, and 7,400 lb of 100 mesh proppant.
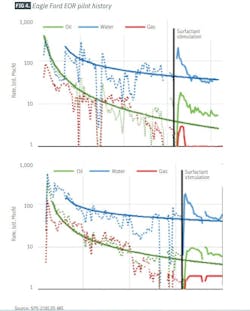
Initial oil production from both wells was about 300 b/d, which declined to about 5 b/d after 7 years. Initial gas rates were about 100 Mscfd and declined to about 1.5 Mscfd after 7 years, with an accelerated decline observed after 4 years accompanied by an increased water cut. Water cuts were 90-93% before the surfactant treatments (Fig. 4).
Surfactant EOR treatments
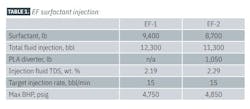
EF-1 and EF-2 EOR treatments both used the same surfactant at 0.22 wt % with treatment volumes about 5× the fracture void volumes. Based on completion designs, 12,300 bbl of bulk fluid containing 9,400 lb of surfactant was injected into the 25-stage EF-1 well, and 11,300 bbl of bulk fluid containing 8,700 lb of surfactant was injected into the 24-stage EF-2 well. Base fluid included fresh and produced water mixed to a 2.2 wt % TDS target. Table 1 summarizes the injection scheme.
PLA diverter
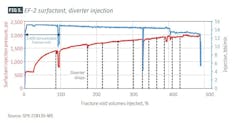
EF-2 surfactant injection included a diverter comprised of 1,050 lb of PLA distributed across 11 batches. The first batch contained 50 lb of diverter and each subsequent batch contained 100 lb with decreasing particle size throughout the injection process. The diverter prevented the surfactant from overtreating high-conductivity fractures by reducing permeability to those areas relative to lower permeability zones. After injection, the PLA hydrolyzes as the reservoir returns to temperature over several days. The hydrolyzed diverter flows back upon production.
Fig. 5 shows injection rates and pressures for the EF-2 treatment. Dashed black lines mark additions of diverter batches to the surfactant. Both EF-1 and EF-2 treatments targeted a 15-bbl/min initial injection rate. Injection profiles were generally similar for both wells, but EF-2 experienced a quicker pressure buildup, likely due to the diverter filling several perforations, and reached higher bottom hole pressure (BHP) despite slightly lower pump rates and a shallower wellbore.
Both wells experienced about a 30-day soak period after shut in for surfactant imbibition and formation adsorption. The PLA diverter also degraded during this time. The soak time was not optimized.
Surfactant EOR effectiveness
A baseline for surfactant uplift analysis used a statistical model created from weighted fits of 10,000 hyperbolic Arps decline curves. These curves produced rate-probability density and cumulative distribution which were aggregated onto a single projected-production rate beyond the treatment date for non-stimulated wells.
Baseline P50-estimated EF-1 production without stimulation for 2 years after the stimulation date was 2,200 bbl, with 2,400 bbl and 600 bbl P10 and P90 estimates, respectively. Actual oil recovery during this period totaled 6,200 bbl, representing 4,000 bbl or 80% more oil recovered than the P50 baseline case.
Baseline P50 estimated EF-2 production without stimulation for 2 years after the stimulation date was 3,300 bbl, with 4,100 bbl and 2,900 bbl P10 and P90 estimates, respectively. These estimates represent a higher expectation for production without stimulation than for EF-1 and a narrower range of expectations. Actual oil recovery during this period totaled 5,500 bbl, representing 2,200 bbl or 67% more oil recovered than the P50 baseline case.
Once back in production, water rates increased significantly for both wells but declined to near pre-stimulation levels about 1 year after stimulation. By contrast, oil rates remained elevated over baseline for 2 years.
Produced water analysis showed that TDS for EF-2 dropped from 8 wt % (pre-stimulation) to 6 wt % immediately after flowback. Mixing between the 2.2 wt % injected water and the original reservoir brine produced this lower-TDS water. TDS slowly increased back to original reservoir salinity.
Almost all injected surfactant remained adsorbed in the reservoir matrix and fracture faces in EF-1 and EF-2. Only about 5% of total injected surfactant was recovered after a significant flowback period. Early EF-2 returns showed trace hydrolyzed PLA diverter, but the degradation products were not detected in later samples. These observations indicate that the PLA diverter completely hydrolyzed and did not negatively affect flowback performance.
Only 35% of the total fluid injected produced back in the first 6-month period, with most of the fluid remaining within the reservoir. Compared with 55% for EF-1, the results for EF-2 suggest that the injected fluid mixed more thoroughly with reservoir water and that the diverter effectively dispersed the treatment across a larger portion of the stimulated reservoir volume.
Despite this improvement, diversion did not appear to improve recovery in EF-2 relative to EF-1. EF-1 demonstrated a significant oil rate increase, most likely from oil mobilized in higher-conductivity zones and fractures in these heavily depleted wells. Surfactant diversion into lower-conductivity zones did not provide clear uplift benefits during early flowback times.
Surfactant huff 'n’ puff simulation
Researchers at Texas A&M created a workflow to evaluate surfactant EOR treatments in shale wells. The workflow was applied to a surfactant huff 'n’ puff pilot in a depleted horizontal well in the black oil window of the EF Shale in Gonzales County, Tex. The nonionic surfactant treatment increased oil production. Only 6% of injected surfactant returned during the first year’s flowback period, indicating that the surfactant successfully bound to the surface of the reservoir and changed its wettability to a more water-wet state to mobilize stranded oil.
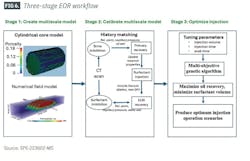
The workflow consisted of three stages (Fig. 6). Stage 1 developed a cylindrical heterogeneous core model using a one-stage field model based on laboratory and pilot field data as inputs and constraints. Laboratory data included core CT scans, surfactant absorption isotherms, and imbibition studies with brine and brine-surfactant mixtures. Large-scale reservoir petrophysics came from well completion details, prefracturing stimulation models, fracturing job data, and production data. A Computer Modelling Group Ltd. STARS reservoir model provided the primary simulation tool.
Stage 2 calibrated the models with historical data in five sequential history matching (HM) stages. Surfactant and brine inhibition data calibrated the core model in two steps to match the 15.1% uplift in oil recovery observed in surfactant-assisted imbibition experiments (Fig. 6, elliptical boxes). Relative permeability and capillary pressure curves of oil-wet, high-IFT, and water-wet, low-IFT states provided end points for tuning. Field model calibration used production and pressure data during primary depletion, surfactant injection, and EOR flowback in three steps (Fig. 6 rectangular boxes). Petrophysics including injection-induced alternations, and the stimulated reservoir volume (SRV) provided tuning.
Stage 3 optimized huff 'n’ puff cycles based on the calibrated reservoir model response. The model sought to maximize cumulative oil production while minimizing cumulative surfactant injection. Optimization parameters included surfactant injection rate, surfactant injection time, and soaking time. A surfactant utility factor (SUF), defined as the ratio of cumulative oil production to cumulative surfactant injection, served as a huff n’ puff surfactant EOR performance benchmark.
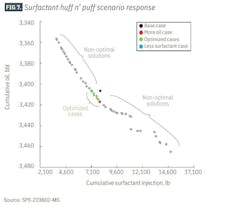
Optimization used a multi-objective genetic algorithm to maximize cumulative oil production while minimizing cumulative surfactant injection. Fig. 7 shows a Pareto curve from 50 simulation cases per generation run for 20 generations of optimization. Table 2 lists the tuning parameters for the simulations. Each generation refined the simulation based SUF performance until reaching an optimum solution.
The black circle represents the base case of 3,406.64 bbl of cumulative oil production for 8,365-lb surfactant injected, producing an SUF of 0.407 bbl/lb. Red and blue circles represent optimized cases with more oil production and less surfactant injected, respectively. Starting from the base case, the blue scenario injected less surfactant but produced equivalent oil, and the red scenario injected the same amount of surfactant but yielded more oil. The green circles represent optimal solutions between the two cases and the gray scenarios are non-optimal solutions to be avoided in practice.
All optimal solutions exhibit larger SUF values than the base case (0.410-0.452 bbl/lb surfactant vs. 0.407 bbl/lb, respectively). The highest oil case requires the largest amount of surfactant and produces the smallest SUF (0.410 bbl/lb) among the optimized solutions. The scenario which required the least surfactant produced the largest SUF (0.452 bbl/lb) while producing similar cumulative oil relative to the base case.
Optimal scenarios require 16.6-18.9 bbl/min injection rates compared with 14.5 bbl/min for the base case and 10–11.3 hr injection times compared with 17 hr for the base case. Optimal soaking periods last 49–65 days, beyond the 30-day soaking period specified for the base case.
Simulation constraints ensured that these scenarios provide practical field-operation guidance with respect to pumping requirements and surfactant availability. The scenarios are not optimized for surfactant and oil prices affecting the economics of surfactant huff 'n’ puff EOR.
Attribution
Based on “East Nesson Bakken Huff ‘n’ Puff Enhanced Oil Recovery Second Pilot: Water-Alternating-Gas Injection using Produced Gas and Water,” SPE-220889-MS, SPE Annual Technical Conference and Exhibition, New Orleans, LA, Sept. 23-25 2024, “Surfactant Huff n Puff Field Trials in Eagle Ford Shale – A Treatment Design Comparative Analysis,” SPE-218135-MS, SPE Improved Oil Recovery Conference, Tulsa, Okla., Apr. 22-25, 2024, and “Enhancing Oil Recovery in Eagle Ford Shale: A Multiscale Simulation Study of Surfactant Huff ‘n’ Puff Methodology,” SPE-223602-PA, Sept. 16, 2024.
About the Author
Alex Procyk
Upstream Editor
Alex Procyk is Upstream Editor at Oil & Gas Journal. He has also served as a principal technical professional at Halliburton and as a completion engineer at ConocoPhillips. He holds a BS in chemistry (1987) from Kent State University and a PhD in chemistry (1992) from Carnegie Mellon University. He is a member of the Society of Petroleum Engineers (SPE).
