Direct gas reservoir detection from seismic wavelets using absorption
The following discussion presents a case history of how a new state-of-the-art seismic processing technology, wavelet energy absorption (WEA), is used in the direct detection of hydrocarbons in a clastic data set in western China.
Also of interest may be a companion article to be presented in these pages in the Jan. 12, 19, and 26 issues that contains a more technical discussion of absorption.
WEA technology is the latest in an evolving series of seismic industry direct detection technologies.
The distinguishing feature of WEA is that the WEA methodology is wavelet based and involves extracting the frequency information contained in the wavelets in order to directly detect hydrocarbon reservoirs in the subsurface. This wavelet based approach means that the WEA method has major advantages when compared to other direct detection methodologies.
The WEA methodology is based on the principal that gas charged reservoirs absorb more seismic energy than nongas-charged reservoirs due to seismic energy being propagated less efficiently through gas-charged mediums.
Through the application of a series of proprietary algorithms, in conjunction with careful conventional seismic processing specifically designed to preserve the required seismic frequency information, the differential energy absorption of the gas reservoirs can be determined by extracting the absorption information directly from the individual seismic wavelets.
A key characteristic of WEA technology is that it generates a volume-oriented result and does not require a target interval to be specified in advance. WEA can be used on either 2D or 3D data, and no well log information is required to calibrate the WEA result.
Although a clastic gas reservoir case history will be presented in the following discussion, substantial success has been achieved in the application of WEA to carbonate reservoirs and for oil detection. However, these efforts are still considered developmental (largely because they are less widely tested).
On the other hand, the reliability of WEA in detecting gas charged clastic reservoirs has been well proven, even in the presence of complicating factors such as coal stringers. Further ongoing developmental efforts should enhance oil detection and bring carbonate reservoir results up to the same level of reliability as gas reservoir detection in clastics.
Data set used in example
The data set discussed in the following case history is 100 sq km of mid-1980s vintage data with relatively low signal to noise (i.e., less than ideal) and is a composite of two merged 3D data sets. It is located in the western Chinese desert.
The following example will show how the WEA result can be synergistically combined with the structural and stratigraphic interpretations utilizing a workstation to provide an overall integrated understanding of the data set that is crucial in the generation of new prospects from heavily explored areas.
Background
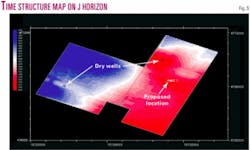
Prior to processing the Chinese 3D data for WEA, what was known about the general area where the 3D data set was located was that the data set had been processed for amplitude, inversion, and amplitude vs. offset (AVO) anomalies, and two 16,000-ft dry holes had been drilled based on these interpretations (Fig. 5).
Analyses of the information from the two 16,000-ft wells indicated that the depositional environment of the deep section penetrated by these wells was fluvial-deltaic, with a source from the south. One of the dry holes had been drilled on a plunging structural nose in a more basinward location, and another had been drilled updip on a localized anticlinal structure located on a structural ridge feature. Both wells were unsuccessful.
Given the lack of success utilizing AVO, inversion, and amplitude on the data set, it was determined to try processing the data set for WEA. Apex Metalink Inc. conducted this work.
Generating the WEA result
In order to successfully apply the WEA methodology to a 3D data set, the sequence of data processing steps must start with the raw seismic field data, which are generally in the form of SEG-Y tapes and field observer notes.
Starting with raw shot gathers is critical for the WEA method because one of the goals of most conventional seismic processing is to generate the best seismic image possible for the purposes of mapping the various seismic horizons, and for fault interpretations.
Providing the best seismic image for these purposes involves processing steps such as spiking deconvolution, which alters and distorts the natural seismic frequencies that are required to obtain the best WEA result. Thus, in this western China example, the starting point for the WEA process is the raw shot gathers.
The tapes were received from the client, read in to the Apex Metalink processing system, and the data set was first processed for geometry and statics in order to check and correct the source and receiver locations for proper positioning. Next, Phase Inversion Deconvolution1 (PID), a proprietary Apex Metalink algorithm, was used to deconvolve the seismic data.
Once PID processing was complete, prestack time migrated gathers were generated. Another Apex proprietary algorithm known as Phase Move-Out2 (PMO) was applied to the migrated gathers. The PMO method flattens the gathers without far offset stretch before stacking.
The resulting migrated stack image was filtered of coherent noise using one more proprietary Apex Metalink algorithm known as Vector Filter3 (VFL). The advantage of VFL is that it can be run many times without damaging the data because it has no Gibbs effect which is common to other filtering algorithms.
Finally, the proprietary Apex absorption processing algorithm, WEA, was applied to the data set to determine the absorption characteristics of the wavelets within the data set. The seismic processing flow used to generate the WEA result is summarized in Table 1.
These processing steps took 60 days from the receipt of the SEG`-Y field tapes.
Seismic and WEA
interpretation on workstation
Once the WEA result had been generated, the WEA information and the seismic data were loaded onto a workstation for interpretation.
The workstation used was the Allied Star Co. (ASC) system. Allied Star Co. is affiliated with Apex Solutions Inc., Beijing, China, a sister company of Apex Metalink Inc.
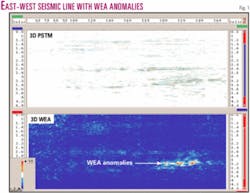
The data set was first reviewed on the workstation in order to determine which of the seismic horizons were associated with WEA anomalies and which would need more detailed interpretation. A review of the data set indicated that most of the WEA anomalies were located at 3.2 sec (16,500 ft) in the eastern portion of the data set (Fig. 1).
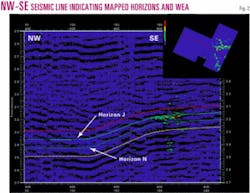
Based on a review of the seismic data, four seismic horizons were selected which adequately bounded the WEA anomalies, and these horizons were correlated on all lines and crosslines throughout the data set. These four horizons are displayed on the NW-SE seismic section in Fig. 2. After a series of test maps and analyses, it was determined that the interval of most interest was the layer located between the horizons designated Horizon J and Horizon N.
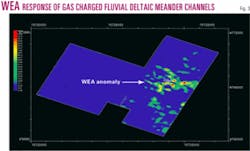
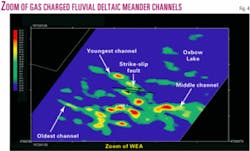
The mapping function of the workstation was used to extract the maximum WEA values for this layer, and a maximum WEA map for the layer was plotted (Fig. 3). A zoom of the area of interest located on the eastern portion of the data set is shown in Fig. 4.
A time structure map was also plotted on top of the upper horizon of interest, Horizon J. This time structure map (Fig. 5) shows a regional dip to the west and a prominent structural ridge on the eastern portion of the data set.
The time structure map is particularly important because it explains why the two previous dry holes in the data set were located where they were, and it explains why the channels on the eastern portion of the data set are gas charged.
As can be seen from Fig. 5, the existing well in the southwestern portion of the data set was drilled on a long, narrow structural nose. This well was a dry hole as would have been predicted by the lack of WEA response in the area of the well. The other dry hole in the northeastern portion of the data set was also drilled on a structural ridge that included a four-way dip structural closure. Also, the lack of a WEA response in the area of this well was indicative of a dry hole.
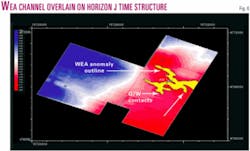
Fig. 6 shows the outline of the maximum WEA response in the Horizon J to Horizon N layer, overlain on top of the time structure map for Horizon J. As can be seen from Figs. 4 and 6, the WEA response indicates that there appears to be a major WEA anomaly feature (in green/red and yellow) located on the eastern portion of the data set. The interpretation of the WEA response is that this WEA anomaly is caused by a stacked series of three gas charged channel sands that have been draped across a structural nose.
The time structure map in Fig. 6 also shows that the draping of the channels across the structural nose is probably what provided the downdip closure and trapping mechanism for the channel sands. A strike-slip fault on the north portion of the anomaly may be the conduit through which the gas migrated up into the channel sand sequence from deeper source rock. In addition, as can be seen in Fig. 6, it appears that several terminations of the channel feature may represent downdip gas-water contacts.
In all there appear to be three separate channels stacked together to give the composite WEA anomaly depicted in Fig. 4. The location of the channels and their orientation in time from oldest to youngest is indicated on Fig. 4.
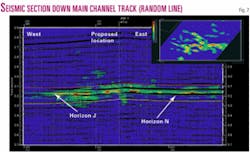
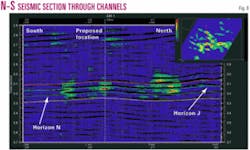
Fig. 7 is a random seismic line generated on the workstation down the center of the main channel track. As expected there is a nearly continuous WEA signature in the interval of interest across most of this random seismic line. Fig. 8 depicts a north south seismic line through the channel sequence, and the WEA anomalies only occur on this line where the seismic line intersects the gas charged channel sequence.
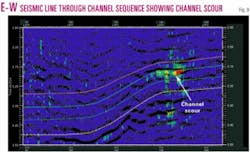
A seismic section through the channel sequence shows what appears to be a channel scour (shown in Fig. 9), and the overall pattern of the WEA response (Fig. 4) is indicative of a classic meandering fluvial channel. Fig. 4 also shows what appears to an oxbow lake feature present in the northeastern portion of the data set that tends to further confirm the channel interpretation.
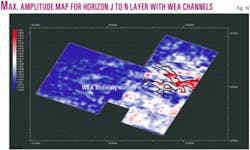
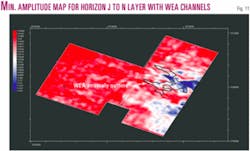
Prior to drilling the two dry holes in the data set, AVO, inversion, and amplitude direct detection methods were utilized on the data set in order to determine the locations for drilling the two wells. Figs. 10 and 11 show the maximum and minimum amplitude maps respectively, for the Horizon J to N layer and show the comparison of the WEA anomalies to the amplitude anomalies in the data set. No AVO or inversion maps were available, and none is included in this discussion.
The minimum and maximum amplitude maps show some correspondence to the gas charged channels found with WEA but the correspondence was weak and would not have identified the optimal drilling locations. The amplitude maps also lacked the resolution of WEA and offered no explanation for the nature of the anomaly (i.e., series of stacked channel sands). This is evident on Figs. 10 and 11.
Summary of prospective area recommendations
Prior to the WEA interpretation on this western China data set, the owner of the data believed the remaining prospective areas in the data set may be located at 7,000 ft below ground level based on the earlier amplitude, inversion, and AVO analyses.
The review of the WEA results indicated something entirely different and showed that the actual area of interest was deeper, at 16,500 ft. Based on the WEA results from the western China data set, the channel area was identified as prospective for future drilling. An optimal proposed drilling location is indicated on Fig. 5 that will test this channel feature.
WEA patent application
A US patent on the WEA technology has been applied for, and the patent is pending.
Conclusion
WEA technology is the latest method in the continuing evolution of direct detection of hydrocarbons from seismic data.
Unlike other methods, the WEA methodology involves extracting absorption information from the physical traveling seismic wavelet that is computed sample by sample, trace by trace.
Importantly, the WEA methodology requires no assumptions and does not use well log curve information for calibration. These and other features give the WEA methodology substantial efficiencies and technical advantages over other direct detection methodologies and allow it to have broader applications in successfully detecting a greater range of hydrocarbon reservoirs than other methods.
References
1. Lichman, E., "Phase Inversion Deconvolution for Surface Consistent Processing and Multiple Attenuation," SEG 69th Annual Meeting Expanded Abstracts, 1999, pp. 1,299-1,302.
2. Lichman, E., "Automated Phase-Based Moveout Correction," SEG 69th Annual Meeting Expanded Abstracts, 1999, pp. 1,299-1,302.
3. Lichman, E., and Northwood, E.J., "High-resolution velocity notch filter without Gibbs effect," Geophysics, Vol. 62, 1997, pp. 274-287.
The authors
Don Squyres is senior geologist with Apex Metalink Inc. in Houston. He has been a professional geologist more than 20 years, starting as an exploration geologist with Exxon Co. USA off Texas, in Northeast Texas carbonates, and the King Ranch Frio-Miocene trend. He also has extensive experience with Class I injection wells and with environmental assessment and remediation. He has a BS in business management from Virginia Polytechnic Institute amd a BS in geology from the University of Houston.
Dr. Eugene Lichman ([email protected]) was a founder of Discovery Bay Co., a geoscience software company now merged with two other companies to form Rock Solid Images, Houston. He previously was senior research geophysicist with Schlumberger Geoquest and is an author of numerous research papers and two US patents, one pending. His current interests include deterministic lithology detection from seismic data, multidimensional deconvolution, and velocity-independent time and depth migration. He holds a PhD in theoretical physics from University of Kalinin.
Scott W. Peters is president of Apex Metalink Inc. Previously he was Asia manager for Jason Geosystems and a geophysicist and wire line engineer for Schlumberger. He holds a geophysics professional degree from Colorado School of Mines and a BS in geophysics from University of Houston.
Zhang Daisheng is project manager of the Tuha exploration department and senior engineer with Tuha Oilfield Branch Co. of PetroChina Co. Ltd. He is the author of several papers on the Taibei depression and Jurassic aspects of the Tuha basin of western China. He majored in petroleum geology in oil and gas geological research and is studying for a PhD at China Mining & Technology University.


