New process detects S-wave data in legacy, land-based P-sourced seismic libraries
Bob A. Hardage
Bureau of Economic Geology
Austin, Tex.
A common geoscientific misconception is that land-based shear-wave (S-wave) seismic data accounts for only a small percentage of the total amount of compressional-wave (P-wave) data acquired in historical seismic surveys. A new mathematical model is proving that SV-P data, which involve a downgoing SV (vertical shear) wave and an upgoing P wave, reside in the same vertical-geophone data containing traditional P-P data. Oversimplified assumptions in the early numerical calculations of P and SV radiation patterns from P sources (vertical vibrators, vertical impacts, and buried explosives) have concealed S-wave images in legacy P-wave data.
New research conducted by Vertishear through the University of Texas, Austin, is reprocessing equal amounts of S-wave data from legacy seismic libraries, recorded by vertical geophones from P sources.
Mathematical assumption
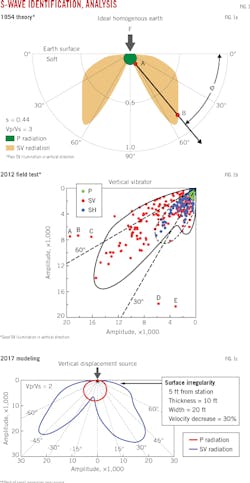
Since the 1950s, scientist have calculated P and SV radiation patterns in the subsurface from a seismic P source with mathematics introduced by Miller and Pursey (Fig. 1a). Geophysicists have agreed that these calculations are true, which has also implied that SV illumination produced by P sources cannot be used for deep imaging in the subsurface. Geophysicists have erred in not looking more closely at the underlying assumptions embedded in the earth models to which P and SV propagation mathematics have been applied. Historic earth models describe the propagation medium in unrealistic fashion. Some of the assumptions include:
• The Earth provides a perfectly flat surface.
• The subsurface is perfectly isotropic.
• The subsurface is perfectly homogenous.
The Earth's surface is seldom flat and typically slopes or has other gentle undulations. Source stations are often surrounded by various grasses, bushes, and trees. Vegetation can in some cases increase stiffness in the subsurface in proportion to the width and depth of its root systems. This stiffness can vary in azimuth directions from the location of seismic sources. Mineral mixtures can also vary in soils-horizontally and vertically-near the surface and can create nonisotropic and nonhomogenous media immediately around a source station. In addition to near-station characteristics, a host of unseen subsurface features affects seismic attenuation. Modeling of P and SV radiation produced by a P source must use more realistic earth models.
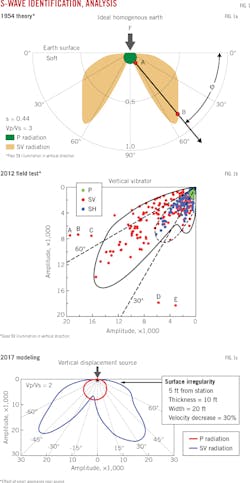
Fig. 1a shows a traditional calculation of P and SV radiation patterns produced by a P-wave source when the propagation medium is mathematically ideal. Historical mathematical models imply there is poor SV radiation at takeoff angles less than 30° from vertical. Fig. 1b displays P and SV radiation patterns found in recent real-data seismic tests. These data indicate good SV radiation for takeoff angles less than 30° from vertical. Fig. 1c depicts the new finite-difference modeling that allows small irregularities in the propagation medium to be near a source station, showing realistic P and SV radiation behavior like that observed in real data (Fig. 1b).
S-wave abundance
Legacy P-wave data libraries contain an abundance of S-wave data awaiting processing by a new mathematical model. For companies that own the data, S-wave interpretation can be accessed at no cost as it is embedded in the same sensor response from which the P-wave images have been developed. Companies seeking legacy P-source data can access digital copies for a simple lease fee from a broker, which costs less than conducting a seismic program.
S-wave data has been ignored for decades in P-sourced seismic data. The misunderstanding is rooted in calculating the geometric shapes and magnitudes of P-wave and SV-wave radiations produced by a P-wave seismic source that geoscientists have used to explain the basic physics of P and SV illumination produced by all land-based P sources.
Radiation patterns
Fig. 1a illustrates important principles behind P and SV radiation patterns. The physical sizes of the radiation patterns show what geoscientists traditionally call a P-wave source, but the source generates more SV shear energy than P energy. This is an encouraging fact when one contemplates the possibility of using P sources to practice S-wave reflection seismology. Much of the radiated SV energy propagates away from a source station at takeoff angles that exceed 30° from vertical. These large takeoff angles mean that most of the SV energy generated by a P source will refract at shallow interfaces, travel horizontally, and fail to illuminate deep geology. This takeoff-angle behavior is the reason that geophysicists have collectively accepted the view that SV radiation generated by a P source cannot be used to construct SVmages of deep geology.
Our study conducted field tests that allow P and SV radiation patterns to be extracted from real seismic data. These tests show that P sources produce radiation patterns like those shown in Fig. 1b. These data contradict the results in Fig. 1a and show that a rich amount of SV energy propagates at takeoff angles less than 30° from vertical. This real-data evidence has led to more realistic earth modeling. Modern finite-difference modeling shows that small, near-source irregularities have large effects on P and SV radiation patterns.
Fig. 1c shows an example of the effect of a small, near-source irregularity. The propagation medium used in this model is an exact, mathematically ideal earth that was used in the calculations exhibited in Fig. 1a except that P and SV velocities are decreased by 30% in a small, surface-exposed zone, 10-ft deep and 20-ft wide, that begins 5 ft from the source station.
Note in Fig. 1c how this small, near-source velocity irregularity in the propagating medium caused a robust amount of SV energy to travel downward at takeoff angles less than 30°. Even in a true vertical direction, P and SV radiation patterns exist in which other small-scale, near-source irregularities are inserted into the propagation medium. Each of these irregularities increases SV illumination inside the desired take-off angle cone of 30° from vertical. As a result, S-wave imaging from P sources is becoming an option, reversing the traditional geoscientific position.
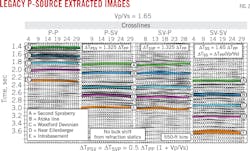
A program of SV imaging with P-source data based on new field tests and numerical modeling is underway. The first imaging effort focused on a 3D 3-component (3C) survey. The processing of these data was based on the concept that the vertical-vibrator array that generated the data sent both P and SV illuminating wavefields into the earth. This dual-illumination concept means that two independent images are embedded in vertical-geophone data, and two different independent images are embedded in horizontal-geophone data. Thus P-source data recorded with 3C geophones contain four images. Fig. 2 represents the first-ever example of full-mode P and SV imaging created from data generated by a P source (3 inline vertical vibrators) and recorded by 3C geophones.
In the hyphenated-label notation identifying these images, the lettering before and following the hyphen references the downgoing and upgoing wavefields, respectively. Fig. 2's P-P image and the SV-P image both can be extracted from legacy P-source data recorded with vertical geophones. This concept opens the possibility that SV-P images can be extracted from legacy P-source data residing in seismic data libraries. The possibility exists that the amount of unprocessed S-wave data for land-based seismic acquisition could equal the total amount of legacy P-wave data.
Since 2015, S-wave imaging with P sources has concentrated on SV-P imaging using vertical-geophone data. Such SV-P images should be identical to P-SV images made from 3C geophone data. Researchers have made several comparisons of SV-P and P-SV images to test the equal-image concept. In only one case, when horizontal-geophone data were particularly good quality, have SV-P and P-SV images been identical. The general finding has been that an SV-P image is better quality than its companion P-SV image. This outcome is thought to be a result of a difference between vertical and horizontal geophones. Vertical geophones record SV-P data and couple it to the earth better than horizontal geophones, which record P-SV data, unless extreme care is given in burying 3C geophones.
Midland basin
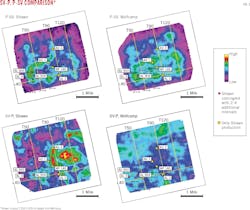
The objective of imaging this legacy data was to compare SV-P and P-SV images of productive Strawn reservoirs in the Midland basin of West Texas. Fig. 3a and 3c compare a P-SV image made from horizontal-geophone data with an SV-P image made from vertical-geophone data.
The P-SV image is contaminated by an acquisition footprint, but the SV-P image has no acquisition footprint, as demonstrated by examining SV-P and P-SV images of the Wolfcamp, 1,000-ft above the Strawn (Fig. 3b and 3d).
Although these SV-P and P-SV images are different, they both show that productive Strawn wells (yellow dots) are associated with a north-south reflection amplitude anomaly. But the amplitude anomalies in the Strawn P-SV image (Fig. 3a) have a suspicious, linear, non-geologic, character. Specifically, the P-SV amplitude anomalies follow straight lines that are oriented in the same directions as source lines (E-W) and receiver lines (N-S).
These straight-line features are acquisition footprints and do not infer geologic conditions. To check for further evidence of acquisition-footprint influence on P-SV imaging in this survey, SV-P and P-SV images of the top of the Wolfcamp interval are shown in Fig. 3b and 3d. The same linear amplitude trends that are in the Strawn P-SV image (Fig. 3a) also appear in the shallower Wolfcamp P-SV image (Fig. 3b), which confirms that P-SV images in this survey are contaminated with an acquisition footprint. In contrast, there is no evidence of an acquisition footprint in either the Strawn (Fig. 3c) or Wolfcamp (Fig. 3d) SV-P images. In this instance, the SV-P image is a more realistic depiction of geology than is its companion P-SV image.
S-wave illumination
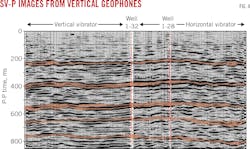
Fig. 4 provides compelling evidence that high-quality SV-P images can be made from P-source data recorded by vertical geophones. The study in south central Kansas that generated the underlying data used 3C geophones to record 2D profile data generated by vertical (P source) and horizontal (S source) vibrators. These SV-P images were produced from vertical-geophone data generated by a vertical vibrator (left half of profile), and by a horizontal vibrator (right half of profile).
Horizontal vibrators generate the best illuminating SV wavefields. But vertical vibrators create SV illuminating wavefields that produce an SV-P image with a higher-frequency tie to the horizontal-vibrator SV-P image at the central calibration well (Fig. 4).
In this comparison, an SV-P image generated by a vertical-vibrator and vertical geophones is shown to the left of calibration well 1-32, and an SV-P image generated by a horizontal-vibrator and vertical geophones is shown to the right of the well. The images tie almost perfectly at the well. Thus, the illuminating SV wavefields produced by a vertical vibrator are, in this case, equivalent to the illuminating SV wavefields produced by a horizontal vibrator.
Seismic wave modes
P = P waves are P-sourced waves that have been widely used for illuminating deep geology for decades.
SV = Shear waves are valuable for geological imaging that can now also be extracted from P-source data.
P-P = The most common reflection data used for imaging, consisting of a downgoing illuminating P wave and an upgoing reflected P wave.
P-SV = Reflection data consisting of a downgoing illuminating P wave and an upgoing SV reflected wave. This is the only shear-wave image made to date with a P source.
SV-P = Reflection data consisting of a downgoing SV illuminating SV wave and an upgoing reflected P wave. This is a new P-source imaging concept just now being demonstrated.
SV-SV = Reflection data consisting of a downgoing SV illuminating wavefield and an upgoing reflected SV wave. Like SV-P, this is a new P-source imaging concept.
The author
Bob A. Hardage ([email protected]) is a senior research scientist at the Bureau of Economic Geology, Austin, Tex. He has also served as exploration manager for Asia and Latin America at Phillips Petroleum and as vice president at WesternAtlas. He holds a PhD in physics from Oklahoma State University, Stillwater, Okla. He is a member of the Society of Exploration Geophysicists and the American Association of Petroleum Geologists.
