Special Report: Seismic, well data used to estimate pore pressure, predict overpressure
An attempt has been made using seismic and well data to predict the possible overpressure zones and pore pressure estimation for the principal reservoir, the Sui Main limestone formation, at Qadirpur, a producing gas field in Pakistan’s Central Indus basin.
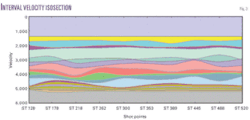
In seismic data, interval velocities are used in the form of iso-interval velocity section for predicting overpressure zones by observing velocity drop (crest) and rise (trough) in different zones and marked high-pressure zones where a velocity drop occurred. The velocity drop observed in an interval velocity contour map is an indicator of hydrocarbons in that zone. This hypothesis is also confirmed by existing producing wells in the same zone.
Well data, sonic logs, and density logs are used to observe the velocity variations and density variation for the Sui Main limestone.
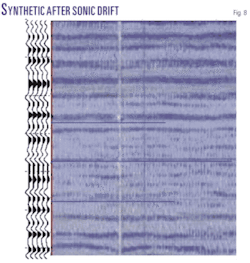
First, a synthetic seismogram is generated to mark the geologic horizons. The methodology introduced here is a calculation of sonic drift from seismic and well data, which greatly improved the results by removing anisotropy from the synthetic seismogram by calculating the velocity drift using common depth point and log data.
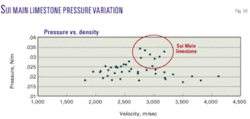
High pressure zone calculations are made by using log data. The plot between pressure and velocity indicated the velocity drop for the Sui Main limestone, which was indicated as a high pressure zone from seismic data calculations.
For pore pressure, distortion in pressure values is observed along with the main increasing pressure trend. These distortions may be due to the presence of any fluid or other material in the pore spaces.
Introduction
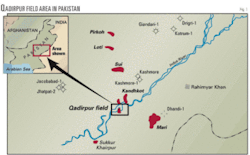
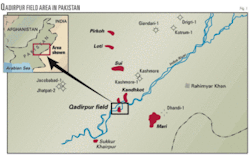
Qadirpur administratively lies in the Ghotki and Jacobabad districts of Sindh Province, Pakistan (Fig. 1).
Previously about 420 lines of 2D seismic survey were shot in 1990, 1992, and 1998 by Oil & Gas Development Corp. Ltd., which discovered gas in Eocene limestones. A total of 35 wells have been drilled in this area, of which 30 wells are currently producing.
Qadirpur field was developed in three phases, increasing its capacity from the initial 235 MMscfd to 500 MMscfd. The aim of the project in progress is to increase field capacity to 600 MMscfd. Development drilling continues in order to maintain the gas supply to Sui Northern Gas Pipeline Ltd.
The Lower Eocene Sui Main limestone is the most prolific gas reservoir in Pakistan. In the Kirthar Range of southern Pakistan and the Punjab platform, the Sui Main limestone is the chronostratigraphic equivalent of the Laki formation, a nonreservoir facies.1
To date, only gas has been encountered in the Sui Main, which has recoverable reserves of more than 20 tcf in the 14 discovered fields. Sui Main is the main producer of gas in Qadirpur field.2
In this study, seismic data with sonic and density logs run in Well 2 are used. These logs are used to generate the synthetic seismogram and to estimate pressure3 as the investigated area is gas prone and pressure related problems often occur in such areas, which led to this study’s goal of detecting overpressure zones before drilling, Interval velocities are used from seismic and well data for matching the results for the Sui Main limestone, as introduced by Sheriff.4
In this study the approach of sonic drift is introduced which played an important role in removing the anisotropy from well data.
Area geology
Geologically the investigated area is in the Mari Kandhkot high, central Indus basin of Pakistan.
It is bounded on the north by the Sargodha high, Indian shield on the east, marginal zone of the Indian plate on the west, and the Sukhar rift in the south.2
The surface is covered by alluvium of the Indus River floodplain. The main potential source rocks are the Sembar shales. The shales of the Mughalkot fomation, the Ranikot formation, and the Sirki formation are also considered for their source potential.5
The Sui Main limestone and Sui Upper limestone are the main producer, whereas the limestone of the Habib Rahi formation is considered as a secondary reservoir.6 7
The Sui Main is a closed-system reservoir, having a huge common aquifer system with all the known and unknown hydrocarbon fields perched at different hydrostatic levels. Being a closed-system reservoir, the gas pools are expected to experience weak aquifer support during fields’ producing lives. This phenomenon has so far been observed in fields that are in a mature stage of production, like Sui field.1
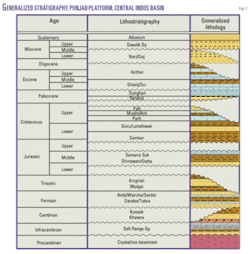
Besides Qadirpur, the Sui Main limestone is gas bearing in many Indus basin fields (Fig. 2). Eocene limestones such as Sui Main have good porosity because of their development on a stable platform, while timely gas entrapment is responsible for the preservation of the porosity. The limestone reservoir in this region has following types of porosities:
- Matrix microporosity.
- Mouldic porosity.
- Vugular porosity.
- Intragranular porosity.
- Intercrystalline porosity.
The most common porosity observed is the matrix microporosity system that is developed by the framework of clay-sized carbonate matrix. Fractures, although present, are not the most important contributors to the development of effective reservoir porosity and permeability in the Sui Main limestone.
In the central Indus basin, the top of the Sui Main limestone (early Eocene ) is a characteristic intra-Eocene reflector because of its acoustic contact with the overlying Ghazij shale, which is seismically transparent and devoid of any significant character.8 The Eocene rocks are represented by heterogeneous lithological assemblage (shales, limestone, evaporite, coal, and minor sandstone) in various basins of Pakistan.
According to Kadri,6 the main drilling problems in the carbonates are severe loss of drilling fluids in porous/fractured gas bearing reservoirs (Sui Main limestone and Habib Rahi limestone). Special care is required in detecting potential blowouts and avoiding permanent formation damage to the reservoir. Stuck-hole conditions are also experienced where considerably thick Eocene shales are drilled.
Use of seismic data
Detection of overpressure before drilling is more useful as precautions can be taken and planning can be done accordingly.
Reflection seismic methods are commonly used for this purpose and exploit the fact that overpressured intervals have lower velocities and impedances than normally pressured intervals at the same depth. During the exploration phase, pore pressure prediction helps in studying the hydrocarbon trap seals, mapping of hydrocarbon migration pathways, analyzing trap configurations and basin geometry, and providing calibrations for basin modeling.
Predrill pore pressure prediction allows for appropriate mud weight to be selected and casing program to be optimized, thereby enabling safe and economic subsurface drilling. The importance of determination of this information has gradually been realized as some major well disasters have led to lives lost and adverse publicity. Besides drilling a well, the only way to predict potential hazards like overpressured subsurface zones is through the use of seismic surveys.9
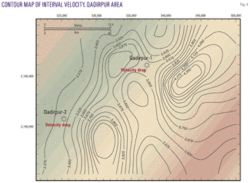
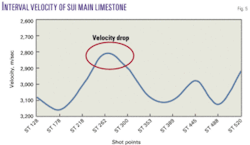
The study involves the application of interval velocities which are important for studying the behavior of rocks and their transit time, porosity, density, pressure, etc. Velocities slow in hydrocarbon zones, including the Sui Main limestone (Fig. 5). The overall behavior of interval velocities for the investigated area and around the well is shown in Figs. 3 and 4.
The zones where velocities drop are hydrocarbon zones, and pressure values rise in these zones for the Sui Main limestone. The estimation of pore pressures from seismic data uses seismically derived velocities to infer the subsurface formation pore pressure. The overpressure zone for the Sui Main limestone is estimated first from seismic data in which we used interval velocities. Interval velocities are used in the form of isovelocity section, which indicated different high pressure zones in the form of velocity drop or crest (Fig. 3). To mark the high pressure zones, a well contour map of the interval velocities (Fig. 4) again confirmed the velocity drop in hydrocarbon zone.
Since our target is the Sui Main limestone, an individual interval velocity for that formation is extracted from an isointerval velocity section to observe the velocity changes.
Overpressured formations exhibit several of the following properties when compared with a normally pressured section at the same depth:10
- Higher porosities.
- Lower bulk densities.
- Lower effective stresses.
- Higher temperatures.
- Lower interval velocities.
- Higher Poisson’s ratios.
Seismic interval velocities are influenced by changes in each of these properties, and this is exhibited in terms of reflection amplitudes in seismic surveys.9 Consequently, velocity determination is the key to pore pressure prediction.4
Use of well data
Changes in pore pressure can be recognized on regular formation evaluation tools such as sonic, resistivity, porosity, and density logs.
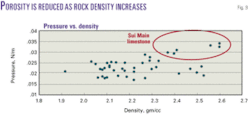
These logs show the effects of pore pressure because of the relationship between compaction, porosity, density, and the electrical and acoustic properties of sediments. As a rock compacts, the porosity is reduced and the density increases, which also causes the bulk modulus and shear modulus to rise because of increases in grain contact area and grain contact stress. This process continues until the mechanical process of compaction is slowed by either the stiffness of the rock frame or by increases in pore pressure that resist further compaction.11
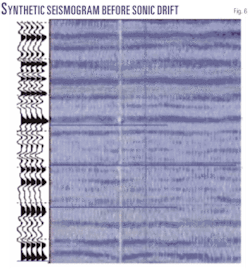
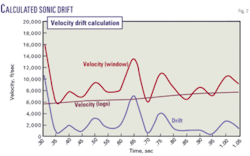
In well data sonic and density logs are used for synthetic seismogram to mark the geologic horizons as shown in Fig. 6. The calculated drift is shown in Fig. 7. The main function of sonic drift is to remove the anisotropy from well velocity so that a synthetic seismogram can be generated without anisotropy to mark the geologic horizons.
Then the concept of sonic drift is introduced to remove the anisotropy from the velocities. The drift is calculated by using the CDP data and well data by taking the difference between log velocity and seismic velocities. After sonic drift calculations, again a synthetic seismogram is generated, as shown in Fig. 8, that is more precise and accurate than the previous synthetic seismogram.
Overpressure in sedimentary basins has been attributed to different mechanisms, but the main ones are related to increase in stress and in situ fluid generating mechanisms.12 The ability of each of these processes to generate overpressure depends on the rock and fluid properties of the sedimentary rocks and their rate of change under the normal range of basin conditions like increases in stress, secondary pressure mechanisms, structural uplift, etc.13
Changes in pore pressure can be recognized on regular formation evaluation tools such as sonic, resistivity, porosity, and density logs. These logs show the effects of pore pressure because of the relationship between compaction, porosity, density, and the electrical and acoustic properties of sediments.14
As a rock compacts, the porosity is reduced and the density increases (Fig. 9), which also causes the bulk modulus and shear modulus to rise because of increases in grain contact area and grain contact stress. In this study, high-pressure zone calculation is made by using log data. After calculating pressure it was plotted against velocity and also against density to observe the pressure variation for the Sui Main limestone. The velocity drop, which was observed by seismic data, is encountered with the same range in well velocity as that of the Sui Main limestone (Fig. 10).
Pore pressure or formation pressure is defined as the pressure acting on the fluids in the pore space of a formation.15 Also, the sonic velocity, density, and resistivity of a normally pressured formation will generally increase with depth of burial, and the way such rock properties vary with burial under normal pore pressure conditions is termed the normal compaction trend.1 6 Pore pressure gradient is defined as the ratio of the formation pressure to the depth and is usually displayed in units of pounds per square inch per foot or Newton meter (N/m) (Fig. 11).
The pore pressure is calculated by plotting pressure against depth. The continuous line (Fig. 11) shows the major increasing trend of the pressure, while the distorted values above and below the line are the indications of some fluid or any other material present there. The pore pressure is calculated by taking the difference above and below the line as shown in the Fig. 11.
Results
The following results are drawn from the calculations discussed.
Interval velocities from seismic data proved to be very informative in delineating the rock properties and pressure zone for the Sui Main limestone. The interval velocity isosection of the whole seismic line indicated the behavior of interval velocity. From this isosection, we can easily understand its behavior by observing its rise and fall.
For the Sui Main limestone the individual velocity is extracted, and it shows velocity drop as in Fig. 5. The velocity drop indicated a high pressure trend in the isointerval velocity section, especially for the Sui Main limestone.
The calculation of sonic drift is used to remove the anisotropy from the well velocities. The effect of sonic drift can be seen in synthetic seismograms and in the pressure calculations, which played a vital role in matching the synthetic with original seismic data and to mark the appropriate pressure zones.
The plot of pressure against density and velocity clearly indicated the pressure rise. The density increased in the zone where pressure increases in the Sui Main limestone (Fig. 9). Similarly for pore pressure is calculated in Fig. 11, which shows a major increasing trend for the Sui Main limestone, and the distortion occurs due to the presence of some fluid or any other material in the pore space.
References
- Siddiqui, N.K., “Sui Main limestone: Regional geology and the analysis of original pressures of a closed-system reservoir in central Pakistan,” AAPG Bull., Vol. 88, No. 7, 2004, pp. 1,007-35.
- Kazmi, A.H., and Jan, M.Q., “Geology and tectonics of Pakistan,” Graphic Publishers, Karachi, January 1997, pp. 483-500.
- Dobrin, M.B., and Savit, C.H., “Introduction to Geophysical Prospecting,” Fourth Edition, McGraw Hill Co., 1988, pp. 803-872.
- Sheriff, R.E., “Exploration Seismology,” Second Edition, Cambridge University Press, 1995.
- Shah, S.M.I., 1977, “Stratigraphy of Pakistan,” Geological Survey of Pakistan, Journal of Canada-Pakistan Cooperation, Ottawa, 1990, pp. 9-27.
- Bender, F.K., and Raza, H.A., “Geology of Pakistan,” Gebruder Borntraeger, Berlin-Stuttgart, 1995, pp. 11-63.
- Chopra, S., and Huffman, A., “Velocity determination for pore pressure prediction,” CSEG, 2006.
- Dutta, N., 2002, “Geopressure prediction using seismic data: current status and the road ahead,” Geophysics, Vol. 67, No. 6, 2002, pp. 2,012-41.
- Bowers, G.L., “Detecting high overpressure,” The Leading Edge, Vol. 21, No. 2, 2002, pp. 174-177.
- Huffman, A.R., “The Future of Pressure Prediction Using Geophysical Methods,” in Huffman, A.R., and Bowers, G.L., eds., “Pressure Regimes in Sedimentary Basins and Their Prediction,” AAPG Memoir 76, 2002, pp. 217-233.
- Osborne, M.J., and Swarbrick, R.E., “Mechanisms for generating overpressure in sedimentary basins: a reevaluation,” AAPG Bull., Vol. 81, 1997, pp. 1,023-41.
- Hubbert, M.K., and Rubey, W.W., “Role of fluid pressures in mechanics of overthrust faulting,” GSA Bull., Vol. 70, 1959, pp. 115-166.
- Hottman, C.E., and Johnson, R.K., 1965, Estimation of formation pressures from log-derived shale properties,” JPT, Vol. 6, 1965, pp. 717-722.
- Pennebaker, E.S., “Seismic data indicate depth and magnitude of abnormal pressure,” World Oil, Vol. 166, 1968, pp. 73-82.
The authors
M. Gulraiz Akhter ([email protected]) is an assistant professor in the Department of Earth Sciences at Quaid-i-Azam University. His areas of interest are exploration geophysics and numerical groundwater modeling. During his 20 years of experience, he has taught mathematics, geophysics techniques, and hydrogeology. He has a masters in geophysics and a PhD in hydrogeology from Quaid-i-Azam University.
Naseer Ahmed has been a scientific officer in the civil and site characteristics group in the Pakistan Nuclear Regulatory Authority since July 2008. Before that he was a geoscientist with LMK Resources. His fields of interest are exploration geophysics, seismology, and hydrogeology. He has a BS in math and physics from Hazra University and an MS in geophysics from Quaid-i-Azam University.
Zulfiqar Ahmad is professor and chairman, Department of Earth Sciences, Quaid-i-Azam University. His work experience includes teaching, research, and administration. He has a PhD with specialization in numerical groundwater flow and solute transport computer modeling from the University of Kentucky, an MSc in hydrogeology from University College, and an MSc in geophysics with specialization in gravity prospecting from Quaid-i-Azam University.
