Borehole seismic defines reservoirs at point of extraction
James Andersen
US Seismic Systems Inc.
Los Angeles, Calif.
Bill Bartling
SR2020 Inc.
Brea, Calif.
H. Roice Nelson, Jr.
Dynamic Measurement LLC
Barker, Tex.
Seismic characterization can be costly. In standard surface acquisition, data are collected well beyond reservoir boundaries. These results are used to map reservoir geometry but often have little effect on individual well performance.
Borehole seismic, also known as vertical seismic profiling (VSP), can be a faster, more economic process that can incrementally achieve an image of the subsurface by comingling surveys from individual wellbores.
Incremental borehole seismic acquisition, processing, and interpretation are significantly less expensive than a traditional surface 3D seismic survey in terms of both time and cost. In addition, borehole seismic typically provides higher resolution imaging than surface seismic and better defines faulting, anisotropy, velocity, and stratigraphic heterogeneities near the discovery borehole.
Although initial predictions often differ from actual reservoir geometries, borehole seismic iterates and provides continual improvement.
The end results are increased production, higher near-term cash flow, higher net value, and higher ultimate recovery of reserves. In effect borehole seismic repurposes reservoir description investments, yielding a better understanding of the immediate subsurface geology allowing operators to drill the best wells first.
In today's economic climate the exploration and production industry often avoids "exotic" solutions to map the subsurface. The issues driving geotechnical evaluation of the subsurface are optimal resource recovery and increasing net present value (NPV) of capital invested in extracting resources.
Both issues can be met with proven 3D seismic and drilling technologies. Borehole seismic however is an example of a proven technology that is not exotic yet is underused, particularly in primary development and production enhancement of oil and gas fields.
Borehole seismic derives from geological concepts developed as early as 1917. Other work conducted in 1935 and again in 1983 further enhanced the process.1-3 Despite this long-term application, the technology is still not adequately applied today. For decades, seismologists have used check-shot surveys to estimate seismic velocities and to serve as a calibration measurement better to predict wellbore depths and their correlation to reservoir defining seismic horizons.
Multiple-receiver arrays and offset check shots led to the development of VSP surveys. With the development of 3D reflection seismic technologies in the 1970s, an obvious expansion was the development of 3D VSP acquisition, processing, and interpretation. Seismologists have further improved these reservoir delineation technologies with the addition of new seismic sources and receivers.
The economics of producing hydrocarbons at increasing expense demand the use of field-proven technology. Technology applications that improve fundamental oilfield metrics (e.g., decreasing finding and development cost or increasing reservoir yield) result in integration by the industry.
Increasing value
Borehole seismic provides information that defines oil and gas reservoirs more accurately, accelerates production, and can increase NPV. More than just finding new reservoirs, the goal of technology today is to improve production within existing reservoirs by further defining the subsurface, taking full advantage of the intricacies within producing reservoirs, and extending fields aerially and vertically.
Production optimization relies on accurately defining reservoir geometries, including identifying compartments that are fault or stratigraphically isolated. Reservoir heterogeneities such as lithology, porosity, and permeability need to be understood. In addition, such reservoir characteristics as pressure and fluid distribution need to be measured because these will change over the life of a field. Borehole seismic provides high resolution data that enable better estimates of these parameters.
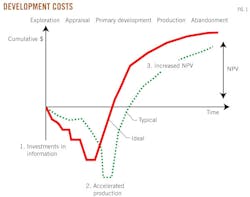
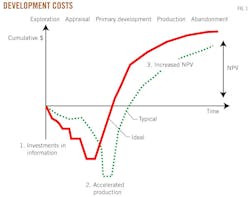
Well defined reservoir geometries and estimated fluid pathways and fluid types give geoscientists the tools needed to optimize production. The key is to get this information as soon as possible to shorten the learning curve in understanding reservoir dynamics. Accelerating production can increase NPV, which creates both short and long-term value throughout the lifetime of a reservoir, from exploration and appraisal through primary development, production, and abandonment (Fig. 1).
Devine field seismic test
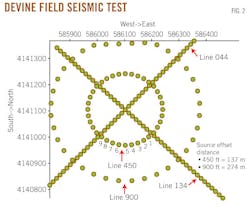
A modern 3D or 4D borehole seismic survey uses an acquisition configuration similar to what is shown in Fig. 2. The map shows the active source positions for the survey. In this particular test, seismic sources included both a vibroseis with a 15-180 hz frequency range to provide an amplitude-controlled frequency-spectrum source and an accelerated weight drop used to expand the lower and upper seismic source frequencies and measure the lower limits of sensitivity of the sensors in a downhole environment.
The borehole receivers covered the well from surface to total depth. This particular test used new fiberoptic receivers, which had a broader and smoother effective frequency range than industry standard electromechanical geophones. Clamps secured the geophones to the borehole to ensure the best possible coupling to the surrounding rocks.
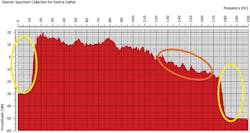
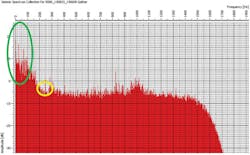
The fiberoptic sensors had a usable frequency range of 15-180 hz with a typical amplitude drop off with the higher frequencies of the sweep (Fig. 3). Optical fiber receivers do not use downhole electronics; therefore the test recorded no electrical noise. The drop off in low and high frequencies at less than 14 hz and greater than 175 hz (highlighted with yellow ellipses) is a function of the vibroseis energy source and not of the fiberoptic receivers. Frequencies lower than 15 hz were not recorded.
Using dynamite as a seismic source would expand both ends of this frequency spectrum. In addition, a high-energy-pulse seismic source could provide additional energy for a range of 130-200 hz or greater (orange ellipse). Flattening and whitening the recorded frequency spectrum after deconvolution improves waveform data.4
Although not a dynamite source, the usable frequency range from an accelerated weight-drop seismic source is 0-300 hz (Fig. 4). The lower and higher frequencies of this range are missing on both conventional and typical borehole seismic surveys. The data from 180 to 300 hz (circled in yellow) are low energy—less than 1 db. If a gain can be applied to the amplitudes, a range of 180-300 hz is more useful.
The good news is this power spectrum does not drop below 0.1 until higher than 1,500 hz for the fiberoptic seismic sensors. The earth naturally filters out higher frequencies, and in general seismologists are not looking for data beyond 180 hz.
Processing window
The Devine field test data were processed in 6 weeks of completing the field acquisition, which is a fraction of the time it takes to design, acquire, process, and interpret a conventional surface seismic survey. This rapid turnaround delivers results on which operators can act. Field management decisions can occur months to years sooner than with traditional surface-recorded 3D surveys, which can ultimately improve production metrics.
Borehole seismic surveys do not require exotic arrangement. Receivers are placed vertically within a wellbore rather than horizontally at the surface. Just as with a surface-recorded survey, the outcome is a depth-migrated seismic volume—only it is delivered faster with improved resolution. Borehole seismic surveys will become more common than surface seismic for developing and optimizing producing fields as geoscientists and engineers become more experienced at looking at data from 3D VSPs.
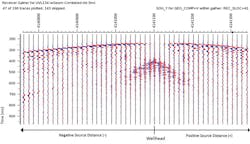
Before geometry correction and seismic processing, borehole seismic field records typically appear different from field records from surface-recorded seismic traces. This is due to differences in VSP geometries that control seismic wave pathways. Fig. 5 shows the traces recorded from sources vibrated along Line 134 shown in Fig. 2, where the left side of the section is to the southeast and the right side is to the northwest. This section shows energy recorded into one level of fiberoptic geophones measuring the vertical or P-wave seismic energy.
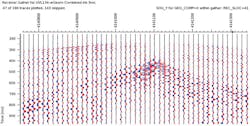
At each level of borehole seismic acquisition, it is possible to have geophones also recording orthogonal shear wave energy. Fig. 6 shows seismic data recorded from one of the shear wave orientations in the Devine field test 3C (three-component) borehole seismic survey equivalent in geometry to the P-wave seismic section shown in Fig. 5.
These contain all of the normal attributes of seismic data with the primary distinction of faster acquisition times and higher frequency content that includes multiple components of seismic energy to enable discrimination of lithologies and fluids.
Aerial coverage
Borehole seismic surveys have been collected for more than 30 years. As with acquisition, processing, and interpretation of any scientific data, there have been mistakes made and lessons learned, documented, and incorporated into the standard processes used today.
Borehole seismic technology is proven and can be more effective in some situations than surface seismic to illuminate the reservoir under development, even with the same type of sources and receivers.
In a borehole survey, seismic distortion issues such as statics only occur as waves travel down. Since the receivers record the energy in the subsurface and the seismic waves only travel one direction, there is less attenuation of high-frequency information, especially by the near surface, but also along a much shorter travel path.
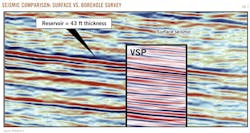
Fig. 7 shows an example of resolution differences, in which borehole seismic data collected with traditional seismic receivers are integrated with surface seismic.5 Notice the much higher frequency content and the nice tie between the data sets. In addition, the continuity as well as the lack of continuity on the borehole seismic insert highlights the higher spatial resolution.
In some cases, borehole seismic is quicker to collect data than with a surface survey because there is typically less areal coverage with fewer source locations and only one receiver location (although often they are positioned at hundreds of depth points). In addition, the surface around a borehole is generally controlled by the company that owns the well, and leasing and access issues can differ from collecting new surface seismic surveys.
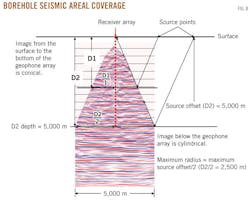
The design of the seismic survey is well defined by the borehole. Fig. 8 shows the typical geometry of borehole acquisition. Under most circumstances, the diameter of the areal coverage of the resultant 3D seismic volume is the same as the depth of the deepest receivers. There is a conical volume of data collected down to the bottom of the geophone array, and then a cylindrical volume of data is collected beneath this depth. As an example, geophones placed downhole to 15,000 ft will result in a cylindrical volume of data slightly less than 3 miles in diameter—an area of more than 4,000 acres.
Borehole seismic surveys include the reciprocity equivalent of multiple check-shot surveys, and these surveys have far better seismic velocity control than surface seismic surveys, which do not directly measure travel times to depths. This feature can be used to control velocity fields required for prestack depth migration and other advanced seismic processing techniques on both borehole and surface seismic surveys.
VSPs result in better looking and more accurate seismic data volumes than traditional 3D seismic surveys. Just as seismic processors have learned effectively to match and then merge multiple 3D seismic surveys over the last couple of decades, it is now routine to match and then merge multiple 3D borehole seismic surveys.
As an illustration, Fig. 9 is a volumetric image showing the merging of seismic velocities and well log data with vertical and horizontal seismic sections through multiple merged borehole seismic surveys. Once a reservoir's extent is delineated, the wells defining water contacts can be used to collect borehole seismic surveys, and these surveys can be used to extrapolate, interpolate, and interpret reservoir geometries between well controls within the reservoir boundaries.
As an example of merged seismic data, Fig. 10 shows an arbitrary line across multiple merged borehole seismic surveys. Note how there is only one readily noticeable seam between merged seismic surveys that shows up on this arbitrary seismic line at inline 245 and crossline 245. Most of the other discontinuities along seismic reflectors appear to be related to geologic inhomogeneities.
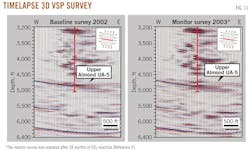
In addition to merging multiple borehole seismic surveys, because they are relatively inexpensive compared with traditional 3D surface seismic, borehole surveys can be used for timelapse or 4D seismic analysis (Figs. 11).
Both figures show vertical sections and depth amplitude maps from a 4D borehole seismic analysis of a Wyoming oil field. The 2002 3D borehole seismic survey was collected as a baseline to compare with surveys collected later.
The monitor survey was collected 18 months after the baseline survey in the summer of 2003. The horizontal amplitude map along the Upper Almond Top UA-5 horizon delineates with high signal-to-noise and great detail the extent and direction of the CO2 flooding over the intervening 18 months of injection.5
Tailored application
Borehole seismic can improve value for infill drilling programs and it can be tailored to provide the right amount of seismic to define producing reservoirs and maximize NPV. This approach cuts upfront surface seismic costs and spreads these costs across the life of the field as new borehole seismic surveys are collected and merged.
Like all geophysical technologies, there are certain environments in which borehole seismic is more effective. These areas include where there are near surface seismic barriers such as sand dunes, air sands, glacial till, and near surface loess that can create significant seismic static errors and attenuation of seismic energy. In fact, wherever there are variations in the geology that affect seismic, where the geology is inhomogeneous, and where there is velocity anisotropy, the availability of borehole seismic technology could reduce the cost of a drilling program.
As an example, in North Dakota's Bakken shale where well spacing can range 0.25 and 1 square mile, borehole seismic could improve understanding of the anisotropy and resulting fracture porosity at different drilling sites. Acquisition, processing, and interpretation work can often be completed in 6 weeks, which can help prioritize capital programs to drill high-potential locations earlier in the program.
The key is to have the right information up front to define oil and gas reservoirs more accurately, accelerate production, and increase NPV.
References
1. Fessenden, R.A., "Method and apparatus for locating ore bodies," US Patent No. 1,240,328, 1917.
2. DeGolyer, E., "Notes on the early history of applied geophysics in the petroleum industry," Journal of the Society of Petroleum Geophysics, Vol. 6, 1935, pp. 1-10.
3. Hardage, B.A., and Toksoz, M.N., "Vertical Seismic Profiling," Part A: Principles, Geophysical Press, London, 1983.
4. Chavarria, J.A., Paulsson, B., Goertz, A., and Karrenbach, M., "High-resolution 3D VSP Processing—An Example from the Middle East," Society of Petroleum Engineers, SPE 118382, Abu Dhabi International Petroleum Exhibition and Conference, Nov. 3-6, 2008.
5. O'Brien, J., Kilbridge, F., and Lim, F., "Time-lapse VSP reservoir monitoring," The Leading Edge, Vol. 23, No. 11, November 2004, pp. 1178-1184.
The authors
James Andersen ([email protected]) is president and chief executive officer at US Seismic Systems Inc., Los Angeles. He began his career as an engineering officer on US Navy Nuclear Submarines, and upon leaving the Navy, went on to hold a variety of technical and senior management positions in high technology companies, including Westinghouse, Whitehall Corp./Hydroscience Inc., Litton Industries Inc., and Northrop Grumman Corp. He holds a BSME from US Naval Academy. He is a member of the Society of Exploration Geophysicists and the Society of Petroleum Engineers.
Bill Bartling ([email protected]) is president and chief executive officer at SR2020 Inc., Brea, Calif. Before joining SR2020 in 2008, he held a variety of technical and senior management positions with Chevron Corp., Occidental Oil and Gas Corp., Silicon Graphics Inc., and CogniSeis Development Inc. He holds a MS in geology from San Diego State University and BA in biology from UC Santa Barbara. He is a member of the Society of Exploration Geophysicists, American Association of Petroleum Geologists, Society of Petroleum Engineers, and the European Association of Geoscientists and Engineers.
H. Roice Nelson, Jr. ([email protected]) is president at Dynamic Measurement LLC, Barker, Tex. He has held technical and senior management positions with Amoco, Mobil, Landmark Graphics, Walden 3-D Inc., and Continuum Resources. He also served as director at the University of Houston's Seismic Acoustics Lab and founded UH's Allied Geophysical Laboratories. He holds a BS in geophysics from the University of Utah and an MBA from Southern Methodist University, Dallas. He is a recipient of the Society of Exploration Geophysicists' Enterprise Award, and is an active member of the American Association of Petroleum Geologists, Geophysical Society of Houston, and the Houston Geological Society.
