Elastic nonlinearity, lower wave velocities add to frequency spectrum
Sofia Khan
Nonlinear Seismic Imaging Inc.
Houston
Current seismic imaging practices have generally ignored the effects of dynamic elastic nonlinearity and treat sedimentary rocks as elastically linear, using a relatively simpler scientific model.
Implicit in the assumption of linearity is that the seismic wave or pulse, recorded after being reflected and refracted, can contain only those frequencies present in the input signal. In the assumption of an elastically linear system-infinitesimal strains or "small" deformations (or strains) share linear relationships between the components of stress and strain-no new frequencies can be generated.
Another assumption is that the contribution of a newly generated seismic wave in the reflected and refracted signals from a porous and permeable rock formation is negligible and can be ignored.
Elastic nonlinearity
Conventional data processing does not account for the existence of new frequencies and lower wave velocities generated by elastic nonlinearity in reservoir rocks. These reflections are mapped as "shadows" or "ghosts" of the compressional wave reflection, which is a function created by poor understanding of actual behavior of seismic wave propagation in porous and permeable reservoir formations.
In reality, reflected and refracted signals from a porous and permeable rock formation have two components. Part of the propagating energy is reflected and refracted from the rock matrix and part of the energy from the pore fluids contained in the rock formation. Once identified, operators can use these new seismic attributes to build more confidence in the interpreted results and derive a more reliable geologic model of the reservoir.
In a nonlinear elastic system, the principle of superposition does not hold. A combination of frequency mixing, harmonic generation, and spectral broadening add new frequencies to the wave spectrum. This provides a means of measuring the elastic nonlinearity parameters of reservoir rocks.
In 2001, Nonlinear Seismic Imaging Inc. (NSII) introduced a new concept of imaging elastic nonlinearity parameters of reservoir rocks. Upgrading the physical model of reservoir with this unique seismic attribute may provide a more rigorous solution to obtain improved results.
The very fact that a rock is porous and permeable means that it will be nonlinear, and the formation's composition is disorderly on a nanoscale. The sensitivity of the nonlinearity response of reservoir rocks is relatively larger than that of the linear measurements such as seismic velocity, attenuation, and modulus. This sensitivity is due to the nonlinear nature of pore fluids, porosity, permeability, and microfractures (Fig. 1).
In a simple magnified area of a porous, permeable, and fluid-saturated reservoir rock, the pores are interconnected. The nonlinearity component is based on the physical science of the subsurface formation as the seismic signal propagates through a fluid-saturated rock. The result is a relative displacement between the rock matrix and the pore fluids.
This fluid movement generates hysteresis and nonlinearity. When the load and unload cycles of any substance differ, then we can say that this object is displaying hysteresis.
Amplitude, viscosity
The amplitude of the nonlinearity component is directly related to the viscosity of the pore fluids. Viscosity describes the liquid's flow resistance. Because the viscosity of oil is higher than that of water, oil-saturated rock will generate a stronger nonlinearity. Thus oil-saturated rock will be differentiated from water-bearing rock.
We have identified three main seismic attributes that differentiate reservoir rocks from all other subsurface formations that exhibit nonporous and nonpermeable properties:
• Seismic compressional waves generate harmonics of all primary frequencies present in the seismic signal as they propagate through a reservoir formation.
• Multiple seismic signals create sum and difference frequencies when propagated through a formation simultaneously, which indicates a unique property of the reservoir.
• Compressional waves propagated through a permeable, fluid-saturated reservoir generate seismic wave identified as the Slow Wave or Drag Wave. The Slow Wave travels more slowly than the compressional wave in the mineral frame of the rock or the compressional wave in the fluid that saturates that reservoir formation. This phenomenon creates a low-frequency wave that will only be present in the reservoir formation and not in any other subsurface rock.
This nonlinearity component can be used to map the reservoir formations.
In practical terms, nonlinear seismic imaging technology was created to map unique signals generated by the propagation of compressional waves through reservoir rock.
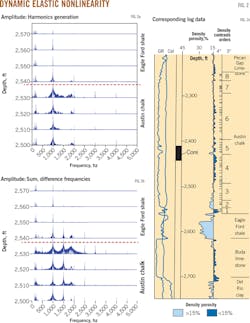
To map permeable units in the interwell space, we used this seismic approach to understand better the flow patterns between wells and between reservoir facies for accurate reservoir simulation in secondary and tertiary recovery and CO2 injection. This effort was driven by the theoretical prediction of elastic nonlinearity created by wave propagation through reservoir formations, and it was necessary to determine whether the harmonics and sum and difference frequencies existed (Fig. 2).
This example, showing part of the cross-well seismic data, represents the frequency spectrum picked up in the receiver well. The distance between the two wells is 990 ft.
Deposited in stable geologic conditions, the subsurface formations have a dip of 1° based on well logs. The depths of the downhole source and receiver were set in the same geologic formation during the recordings. The source transmitted a monofrequency signal of 1,000 hz, and the cross-well data were recorded at 10-ft depth intervals. We then analyzed the recorded data with fast Fourier transform. The Lower Austin Chalk section of about 30 ft shows the highest porosity of more than 15% and is continuous between the two wells.
The frequency spectrum of the cross-well data indicates that there is higher elastic nonlinearity in the lower 30 ft of the Austin Chalk overlying the Eagle Ford shale. The elastic nonlinearity of the rocks in the interwell space is indicated by the relative amplitude levels of the harmonics (2,000 hz, 3,000 hz, and 4,000 hz) in the frequency spectrum plot of the cross-well data. There are no harmonics in the data where the seismic signal propagates through nonporous Eagle Ford shale.
Harmonics
The relative amplitude of harmonics is an indicator for mapping porosity of reservoir formations. Shales and clays that are nonporous generate little or no harmonics.
Fig. 2c represents corresponding log data from the Devine test site. The density and porosity logs show also that the lower 30 ft of the chalk has the highest porosity, which is above 15%. The formation is water saturated.
We repeated the cross-well evaluation, using two frequencies transmitted simultaneously: 1,000 hz and 1,500 hz. The results confirmed that, in a nonlinear medium, interaction between two frequencies propagating simultaneously form sum and difference frequencies. The sum frequency (2,500 hz) and difference frequency (500 hz) are noticeable in the Lower Austin chalk, which has more than 15% porosity.
The newly generated frequencies in the form of harmonics and the sum and difference are unique seismic attributes that directly correlate with reservoir porosity, fractures, and pore fluids. Notice that the harmonics and sum and difference frequencies are not present in Eagle Ford shale just below Austin Chalk (Figs. 2a and 2b).
The analysis of the cross-well seismic data shows that the measurement of the relative amplitudes of harmonics and sum and difference frequencies can be used to distinguish and map porous (fluid-saturated) and nonporous sections of a reservoir.
Based on these cross-well seismic results, we identified that the nonlinearity component of fluid-saturated reservoir rocks is more than 100 times larger than nonporous formations and would indicate viable oil and gas accumulations.
Based on the confirmation of theoretical expectations, NSII developed new methods of mapping fluid-saturated rocks, fractured reservoirs, stratigraphic traps, and reservoir properties such as tortuosity, permeability, and porosity.
Mapping indication
Porosity profile mapping on existing or potential reservoirs can eliminate the costs of drilling dry wells.
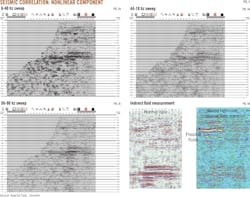
Fig. 3 shows processed results of data acquired by Apache Corp. The test was carried out with two sets of vibrators, one transmitting a 6-40 hz swept signal and the second transmitting a monofrequency signal of 50 hz. Because of limited time, these data do not have full common depth point coverage.
Fig. 3a provides correlated results of the 6-40 hz sweep, which represents the normal subsurface 2D seismic image. The seismic reflections representing the subsurface, clearly identified, show structural detail, but it would be difficult to perform further interpretation on the possible accumulations of reservoir fluids.
The nonlinearity component represents the difference frequency displayed with correlation after the 44-10 hz sweep (Fig. 3b). An anomaly appears in a shallower zone. There is some reflected signal in the deeper horizon, but the signal lacks continuity.
Fig. 3c displays the nonlinearity component of the summed frequencies that result from the correlation with the higher frequency 56-90 hz swept signal. Combined, both results indicate the presence of the nonlinearity component in the reflected signals, which stack during conventional data processing (Figs. 3b and 3c).
With additional processing, seismic results display the normal data and the nonlinearity component data (Fig. 3d). The normal data provide structural complexity of the subsurface, which may be faulted, and identify the deeper formations that produce gas several kilometers away from the test site.
An anomaly appears on the nonlinearity component image on the right side, which may indicate the presence of fluids (Fig. 3d). The lack of continuity in the deeper horizons indicates the presence of fluids but of no commercial interest.
In this example, the nonlinearity component is used to define a fluid-saturated reservoir. These concepts can delineate other reservoirs both on land and offshore.
Deeper zones
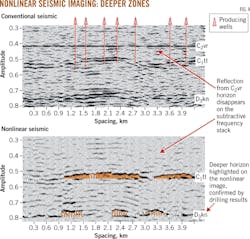
In the case of multiple (deeper) zones, both can be mapped simultaneously. It is noticeable that once our results and articles were published from 2001 to 2006, similar tests of our patented concepts and field methods were carried out independently by Russian scientists with a 30-100 hz swept frequency signal and a monofrequency signal of 22 hz (Fig. 4).1
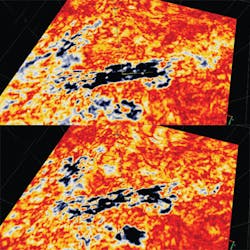
The upper section shows the normal structural features on a conventional seismic image and the lower portion displays the nonlinearity component (Fig. 4). It is important to note that the shallow reflected horizon disappears on the nonlinearity component stack. The absence of the shallow reflection is caused by a tight, nonporous formation.
The oil in the subsurface is highlighted by the nonlinearity component of the reflected signal. The presence of oil is confirmed by the producing wells in that oil field. The lower image also highlights pockets of oil in the deeper horizon.
At the time of this original research, it was unknown whether the areas highlighted in the deeper horizon contained hydrocarbons (labeled D3kn). There were no well data at the time; however, drilling has since confirmed the presence of hydrocarbons in the D3kn sediments.1
Nonlinear seismic imaging technology is directly responsible for the appearance of these deeper zones showing only the highlighted hydrocarbon zones. The unproductive layer of rock shown in the conventional image is omitted completely. As a result, there is potential to define exact drilling targets further.
Slow, drag waves
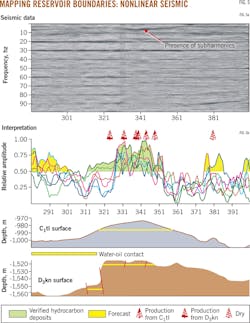
Slow waves are capable of generating unique, independent signals that can identify the reservoir (Fig. 5).
A simple field test transmitted individual monofrequencies of 20 and 30 hz signals and recorded data with surface geophones, which created a plot of the harmonics (Fig. 5). The test's purpose was to evaluate the relationship of harmonics and sum and difference frequencies to identify the relationship between known subsurface oil accumulations and their nonlinearity component.
We have seen a direct match between the sum of the harmonic amplitudes and the oil column in the reservoir. In this test, reservoir depths are 3,000 and 5,000 ft, respectively.
An interesting feature is the presence of subharmonics, the amplitude of which was generated by the Drag Wave traveling through the permeable and porous reservoir rocks. In turn, the resulting image shows the location of fluids in the subsurface. As nonlinear seismic imaging evolves, the technology may become useful for mapping changes in reservoir quality and gas and liquid contact boundaries.
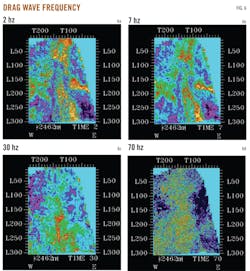
With an impulse source, nonlinear seismic technology can identify and map formations even with no acoustic impedance contrast between the reservoir and other nonreservoir sedimentary rocks (Figs. 6a-6d).
As Drag Waves or Slow Waves travel through the reservoir, they are transmitted through tortuous paths. The lower frequencies generated through this process can be used for further analysis on existing data.
These newly created frequencies are not generated by the source but in the subsurface reservoir rocks and will represent the nonlinearity component of the formation.
The example in Fig. 6 shows a carbonates environment in which the porosity is a result of diagenesis. Structural mapping did not show any anomalies related to this reservoir rock. The area is heavily faulted, and the mineralized water seeping through the faults created the reservoir's porosity.
Because there is no reflection, it is difficult to interpret this feature from existing seismic data. Any method capable of differentiating this situation, therefore, will create an exploration opportunity.
A reservoir's nonlinearity component is generated with the help of a seismic impulse source as a result of Slow Wave or Drag Wave effect.
In the case of an impulse, on land or in marine environments, the spectrum of the seismic wavelet is modified as the signal propagates through a fractured or porous formation. The interaction and the mixing of the frequencies generate new higher and lower frequencies not present in the original signal. The entire spectrum shifts down, all the way to 1 hz-this is the Drag Wave concept.
By preserving the lower frequencies of the seismic spectrum (down to 1-2 hz), nonlinear seismic technology provides further analysis by imaging the lower frequencies to highlight reservoir rocks. Filtering methods such as spectral decomposition can be used to display the lower frequencies to map the reservoir formations.
Three-dimensional seismic data must be displayed over preselected time windows. For example, a time window of 100-150 ms can be applied to the expected zone of interest where there is an expected reservoir formation. Different time windows can be selected to develop images from different formations at different depths.
The measurement of the relative amplitudes of lower frequencies in the seismic spectrum of a particular subsurface horizon (2-6 hz) strongly indicates the presence of a high-viscosity pore fluid such as oil (Fig. 6). This will manifest as a lower-frequency bright spot on the seismic subsurface reflection image. The dominance of the relative amplitudes of these lower frequencies in the seismic-reflected signals of a particular subsurface formation indicates that these frequencies are being generated in that particular reservoir.
Above 20 hz, the bright areas are no longer distinguishable (Fig. 6c). This invention stresses the importance of the Drag Wave effect in porous, permeable formations by illuminating the higher porosity volumes of the subsurface rock.
To confirm that an anomaly is in fact fluid-saturated hydrocarbon reservoir rock, we use a processing method that will highlight the extent and location of the reservoir only due to the spectral broadening of the original input signal.
These newly created frequencies are not generated by the seismic source; they are the result of the Slow Wave or Drag Wave effect (Figs. 7). New lower frequencies (Fig. 7a) and higher frequencies (Fig. 7b) are generated by the nonlinear component within the formation and are not originally present in the input seismic pulse.
Mapping these new frequencies provides a new method for mapping reservoir formations saturated with hydrocarbons. Without porosity and permeability, lower and higher frequencies of importance will not be generated.
Productive, unproductive zones
Based on field examples, nonlinear seismic technology can identify how oil and gas producing zones are highlighted and unproductive rocks obscured. Nonlinear seismic imaging generates multiple images of the subsurface. The conventional linear seismic images are retained to provide the structural information, and additional nonlinearity component images are provided to display the fluids of interest.
Empirical results support the theoretical development of this new technology that uses elastic nonlinearity within a reservoir to map and locate the subsurface formations. The imaging of fluid-saturated rock is unique in the sense that the nonlinearity component is generated in the reservoir itself.
This technology may assist with identifying hydrocarbons in reservoirs that cannot be mapped due to current technological shortcomings. Rather than mapping structures in contrast, this new approach is capable of mapping fluids of interest.
References
1. Zhukov, A.P., Loginov, K.I., Shneerson, M.B., Shulakova, V.E., Kharisov, R.G., and Ekimenko, V.A., "Nonlinear properties of vibrator-generated wavefields and their application to hydrocarbon detection," The Leading Edge, November 2007, p. 1,395.
The author
Sofia Khan ([email protected]) is president at Nonlinear Seismic Imaging Inc., Houston. She has also served as a settlement planning consultant in the securities, insurance, and legal industries. She holds a BA in managerial studies from Rice University and an MBA from the University of Houston, both in Houston. She is a member of the Society of Exploration Geophysicists, the European Association of Geoscientists and Engineers, and the Women's Energy Network.


