Oil price affects Egyptian waterflood options
Mohamed Abd El-Nasser
Qarun Petroleum Co.
Cairo
Abdelwahab Bayoumi
Sayed Gomaa
Al-Azhar University
Cairo
Two waterflooding options were evaluated to develop Abu Roash G (ARG) reservoir in Egypt’s Western Desert. Natural dump flood (NDF) was compared with surface injection in terms of oil recovery and net present values (NPV). Sophisticated geological characterization with detailed hydraulic flow units (HFU) produced an accurate model of the reservoir. Integrated production analysis combined reservoir simulation and material balance and provided model consistency and robustness.
The results show that surface water injection was the major contributor to economically sustaining field production at mid reservoir life. It was not the optimum development strategy, however, during early production based on oil prices at the time. Comparing ultimate recovery (UR) between natural dump flood and surface injection showed that surface injection accelerated UR and positively impacted field economics.
ARG reservoir waterflooding
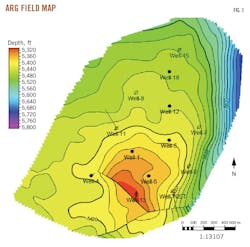
ARG reservoir is the main producing target in a depletion drive field in Egypt’s Western Desert. Six injectors and seven producers were drilled for field development. Fig. 1 shows the field structure map with well locations.
In 1999, the first field water-flood pilot converted high water cut wells into a natural dump flood. Offset producer monitoring determined the response of the dump flood. Field recovery improved by further drilling injector wells and shifting to a surface injection system. Field recovery factor (RF) increased from 8% at the start of natural water flooding to 33% after 22 years of production with the two water injection systems.
The injection study used the field’s entire production and injection history, coupled with oil price changes over the duration of field development, to assess optimum depletion recovery strategy.
Reservoir characterization
Integrated waterflood asset management combines reservoir characterization, reservoir genesis, fluid analysis and behavior in the reservoir, well operations, and surface fluid processing. Pressure-volume-temperature (PVT) relationships determine fluid type, and core data establish reservoir porosity-permeability relationships.
Reservoir fluid is 33° API black oil with a bubble-point pressure of 361 psi. A permeability-porosity cross-plot constructed from 194 core samples over the entire reservoir showed poor correlation with 0.564 correlation coefficient. The ARG reservoir was subdivided into three HFU containing distinct properties (OGJ, Mar. 1, 2021, p. 22).
Using the HFU approach, a flow zone indicator (FZI) reflects differences in rock characteristics between producing zones which have substantial impact on production and injection performances. Fig. 2 depicts the permeability distribution along the reservoir from the HFUs.
A single relative permeability curve represents normalized and denormalized relative permeability data obtained from 14 core plugs. Capillary pressure and water saturation were obtained with the saturation-height modeling technique using core data from three wells and calculated water saturation from petrophysical data. These were subsequently used in the dynamic simulation model to distribute water saturation along the reservoir. This method determines water saturation in the transition zone and will impact oil initially in place (OIIP) calculations and fluid flow behavior.
Reservoir performance
The material balance technique uses pressure-production data to calculate OIIP in addition to identifying driving indices. Material balance quantitatively describes the presence and strength of the aquifer. Based on reservoir heterogeneity and pressure data, water-bearing zones exist in some wells and are absent in others. A multi-tank model, therefore, properly represents the ARG reservoir.
The reservoir was subdivided into two tanks (Tank 1 and Tank 2). Tank 1, which includes all wells except Well 15 and Well 18, simulates Sands 2-5. These sands have weak aquifer pressure support resulting in reservoir pressure depletion throughout the primary recovery period.
Sand 1 can be found in three wells, (Well 1, Well 15, and Well 18). It was completed in Well 1 in 1997 and was commingled with the higher porosity and permeability lower sand channels. Well 15 was completed in Sand 1 only in 2011 and exhibited virgin pressure. It is assumed, therefore, that production from Sand 1 in Well 1 was minor, and Sand 1 was modeled as a separate tank between Well 15 and Well 18.
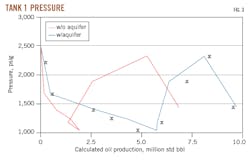
The Tank 1 analytical model reveals poor history match if an aquifer is omitted (Fig. 3, red line). By contrast, good history match occurs when the tank includes an aquifer with 22 million std bbl OIIP (Fig. 3, blue line).
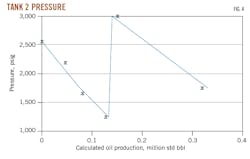
Tank 2 has only two wells (Well 15 and Well 18), and it modeled Sand 1. It has no pressure support (i.e. no aquifer), resulting in depletion which reached 370 psi before starting water injection. The Tank 2 analytical model produces an excellent fit with historical data without an aquifer present (Fig. 4). Estimated OIIP is 4.5 million std bbl. Total OIIP for the two tanks representing the entire reservoir is 26.5 million std bbl.
Static, dynamic model
The static reservoir simulation model has a total of 1,056,440 grid cells containing 1,036,367 active cells and 20,073 inactive cells. Grid cell size is 25 × 25 m with vertical resolution of 0.6 m. The static model includes a complete fault and structure model with the best-understood field geology.
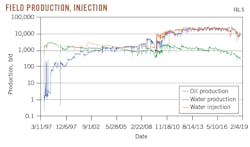
The dynamic simulation model was built from 22 years of production history (Fig. 5) using field special core analysis (SCAL) data and a black oil fluid. OIIP was 30.8 million std bbl for model initialization from the simulation model. For comparison, OIIP is 32.0 million std bbl from a volumetric reservoir calculation and 26.5 million std bbl by material balance.
History matching
The simulation model matched production history on both field and well levels. History matching included the following processes:
- Adding an aquifer to the models. Material balance analysis showed that the presence of a small aquifer improved the quality of model matching. The simulation model considers an aquifer region in one edge direction. Both simulation and material balance models are consistent with the presence of an aquifer.
- Manual tuning of relative permeability curves. The manual tuning for relative permeability globally improved matching quality.
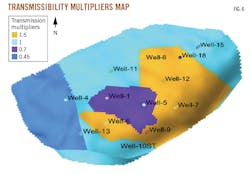
- Applying a transmissibility multiplier over four segmented regions. Facies distribution described four regions with different transmissibility multipliers guided by well production and injection. Fig. 6 shows the transmissibility multiplier map for the final history matching case.
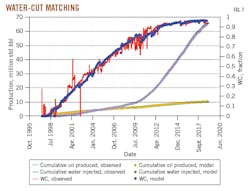
Fig. 7 illustrates the match on the field scale using the above processes.
Recovery
After history matching, the model was ready to simulate ARG reservoir’s performance under various production and injection strategies from the start of production through to end of December 2018. The results demonstrated the relevance of waterflood application in such a reservoir and determined that the reservoir was appropriately developed.
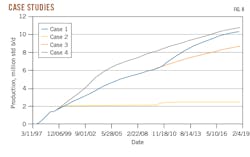
Several simulation cases demonstrate the value of different development plans. The cases cover the historical production period and include:
- Case 1 (actual case). The field produced with depletion drive for 2 years, then with natural dump flood for 10 years. In the last phase the field produced with a surface injection system for 10 years.
- Case 2 (hypothetical case). It is assumed that the field produced with depletion drive for 22 years.
- Case 3 (hypothetical case). It is assumed that the field produced with depletion drive for 2 years, then with natural dump flood for 20 years.
- Case 4 (hypothetical case). It is assumed that the field produced with depletion driving for 2 years, then with a surface injection system for 20 years.
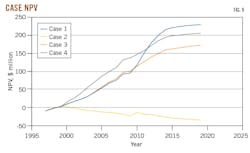
The four cases ran over the 22-year historical period to show how different development strategies throughout the field’s life affect recovery and field economics. Economic calculations required historical oil prices, field operating expenditures, and field capital expenditures. NPV measured economic performance of the different cases. Figs. 8-9 compare cumulative oil production and NPV for the four cases, respectively, and Table 1 summarizes the results.
Case 1 shows the highest NPV. Case 3 shows that dump flood can economically produce the field, but surface injection improved field estimated ultimate recovery (EUR) to 10.3 million std bbl compared with 8.8 million std bbl using only dump flood. By comparison, only 2.5 million std bbl were recovered in Case 2 using depletion drive, and it was not economic to develop the field this way.
Economically, natural dump flood (Case 3) shows a feasible development strategy for water injection during early production life. Surface injection was not the best choice when production first started due to combined low oil prices and high cost of drilling water injection wells and constructing surface injection infrastructure including tanks, flowlines, pumps, and chemical treatment. Later-period high oil prices supported surface water injection.
For analogous reservoirs, detailed reservoir characterization using the HFU technique improves forward modeling and will influence the locations of water injectors, which is critical for a successful waterflood project.
Bibliography
Abd El-Gawad, E.A., Abdelwahhab, M.A., Bekiet, M.H., Noah, A.Z., ElSayed, N.A., and Abd Elhamed, E.F., “Static reservoir modeling of El Wastani formation, for justifying development plans, using 2D seismic and well log data in Scarab field, offshore Nile Delta, Egypt,” 103546, Journal of African Earth Sciences, Vol. 158, October 2019.
Ahmed, T., “Reservoir engineering handbook,” Gulf Professional Publishing, Elsevier, 2018.
Alharbi, A., “Experimental Evaluation of the Effect of Carbonate Heterogeneity on Oil Recovery to Water and Gas Injections,” unpublished doctoral thesis, University of Calgary, 2013.
Amaefule, J.O., Altunbay, M., Tiab, D., Kersey, D.G., and Keelan, D.K., “Enhanced Reservoir Description: Using Core and Log Data to Identify Hydraulic (Flow) Units and Predict Permeability in Uncored Intervals/Wells,” SPE-26436-MS, SPE Annual Technical Conference and Exhibition, Houston, Tex., Oct. 3-6, 1993.
Bayoumi, A., Gomaa, E., and Hamdy, A., “Heterogeneous Reservoir Characterization (Upper Bahariya Case study),” Second Proceedings of Al Azhar’s 14th International Conference On: Engineering, Architecture and Technology, Vol. 2, No. 4, Jan. 1, 2018.
Carlson, M.R., “Practical reservoir simulation: using, assessing, and developing results,” PennWell Books, Tulsa, Okla., 2003.
Elsheikh, A., Setto, I., and Abdelhady, A.A., “Reservoir characterization and 3D modeling of the Aptian Alamein Formation in North Razzak area (North Western Desert, Egypt),” 104039, Journal of African Earth Sciences, Vol. 173, January 2021.
Fanchi, J.R., “Principles of applied reservoir simulation,” Elsevier, 2005.
Harrison, B. and Jing, X.D., “Saturation Height Methods and Their Impact on Volumetric Hydrocarbon in Place Estimates,” SPE-71326-MS, SPE Annual Technical Conference and Exhibition, New Orleans, La., Sept. 30-Oct. 1, 2001.
Ibrahim, M.M., Abdulaziz, A.M., and Fattah, K.A., “Rejuvenation of a Mature Field Through STOIIP Validation Using an Integrated 3D Geo-Cellular Dynamic Model for a Heterogeneous Multi Layered Reservoir,” SPE-183565-MS, Abu Dhabi International Petroleum Exhibition & Conference, Abu Dhabi, UAE, Nov. 7-10, 2016.
Salih, O.A., Tantawy, M.A., Elayouty, S., and Abd Hady, A., “Oil Reserves Evaluation and Field Development plan of Hakim Oil Field in Libya,” Journal of Petroleum and Mining Engineering. Vol. 18, December 2016, pp. 39-53.
Satter, A. and Thakur, G.C., “Integrated petroleum reservoir management: a team approach,” PennWell Books, Tulsa, Okla., 1994.
Stanley Okafor, I., Ebenezer Ubani, C., and Anyanwu, N., “Development Strategies for Oil Reservoirs with Coning Problems: A Simulation Case Study,” SPE-193451-MS, SPE Nigeria Annual International Conference and Exhibition, Lagos, Nigeria, Aug. 6-8, 2018.
Thakur, G.C., and Satter, A., “Integrated waterflood asset management”, PennWell Books, Tulsa, Okla., 1998.
Wei, C., Xiong, L., Zheng, J., and Li, B., “A Comprehensive Reservoir Characterization and Water Flooding Optimization for Different Types of Reservoir – Case Study of a Giant Carbonate Reservoir in the Middle East,” SPE-189236-MS, SPE Symposium: Production Enhancement and Cost Optimisation, Kuala Lumpur, Malaysia, Nov. 7-8, 2017.
The authors
M. G. AbdElNasser ([email protected]) is a reservoir assistant general manager at Khalda Petroleum Co. in Egypt. He holds a BS (2006) and an MS (2022) in petroleum engineering from Al-Azhar University, Cairo. Mohamed is a member of the Egyptian Engineers Syndicate and the Society of Petroleum Engineers (SPE).
Dr. Sayed Gomaa ([email protected]) is an associate professor of petroleum reservoir engineering at Al-Azhar University and the British University in Egypt. He holds a BS (1999) and an MS (2005) in petroleum engineering from Al-Azhar University and a PhD (2010) in petroleum engineering from Azerbaijan State Oil Academy.
Dr. Abdel Wahab Bayoumi ([email protected]) is a professor of petroleum engineering at Al-Azhar University, Cairo. He holds a BS (1971) and an MS (1974) in petroleum engineering from Al-Azhar University and a PhD (1980) in petroleum engineering from the Oil and Gas Institute, Ploiest, Romania. He is a member of the Egyptian Engineers Syndicate and SPE.
