New assessment suggests substantial Appalachian shale gas resources
BJ Carney
Northeast Natural Energy LLC
Charleston, W.Va.
Ray Boswell
National Energy Technology Laboratory
Pittsburgh, Pa.
Susan Pool
West Virginia Geological & Economic Survey
Morgantown, W.Va.
A new approach to determine technically recoverable gas resources (TRR) carefully screened well-performance data and mapped TRR at high spatial resolution in Marcellus and Utica shale plays. This approach estimated 693 tcf remaining (undiscovered) technically recoverable gas resources (rTRR) for the Marcellus play and 684 tcf for the Utica gas play, exceeding many recent assessments.
Appalachian resources
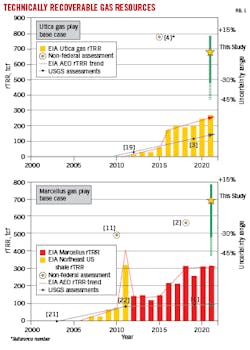
Despite a decade of extensive development, there is increasing uncertainty in the assessment of remaining resource potential of Appalachian basin shale gas plays (Fig. 1, yellow stars with green vertical bars denote the result and uncertainty of the current study). Recent rTRR estimates in the Marcellus range from less than 97 tcf to more than 560 tcf.1 2 The range for the gas-bearing portion of the Utica play is from 103 tcf to more than 770 tcf.3 4 Gas-in-place (GIP) is less commonly assessed, but recent GIP assessments indicate 2,322 tcf for the Marcellus and 3,192 tcf for the Utica.4 5
An initial effort to address these uncertainties focused on developing new approaches for TRR assessment and applying those to the Marcellus in West Virginia.6 This effort was followed by a reevaluation of Marcellus GIP in West Virginia.7 Most recently, the TRR assessment has been extended to an initial review of both the Marcellus and Utica plays throughout the basin.8 Together, these studies reveal that cumulative production to date commonly exceeds prevailing estimates of rTRR. Further, projected local ultimate productivity exceeds both TRR and GIP, suggesting that Appalachian gas resources are significantly undervalued.
Previous rTRR estimates
The US Geological Survey (USGS) periodically reports probabilistic assessments of rTRR for major plays. Their terminology is “undiscovered TRR,” which allocates a play area into drilled and undrilled cells, then assigns probabilistic characterizations of geologic risk and per cell recovery to the undrilled cells. The most recent assessment from Higley et al. assigned a mean of 96.5 tcf rTRR for the Marcellus play.1
The Energy Information Administration (EIA) annually assigns an rTRR value for select major oil and gas plays to support energy supply modeling for their Annual Energy Outlook (AEO). Its terminology is “unproved TRR” and its latest estimate sets the Marcellus at about 319 tcf and anticipates further growth with future technology development.9
Independent research groups also have periodically assessed Appalachian recoverable resources. Perhaps the most impactful assessment was simple volumetric calculations indicating uTRR of about 490 tcf by referencing the size of the Marcellus basin and productivity of analog wells.10 11 Recent engineering and geological analyses support resources at this scale.2
Assessments for the gas-prone portions of the Utica play show a similar trend to those for the Marcellus. A consortium of Appalachian basin geological surveys set rTRR at 774 tcf by integrating early drilling results in the highly over-pressured Utica deep gas trend along the eastern margin of the play.4 By contrast, the most recent assessment by the USGS assigns 102.7 tcf rTRR to the Utica while the most recent Utica EIA estimate for AEO 2021 is 266.2 tcf rTRR.
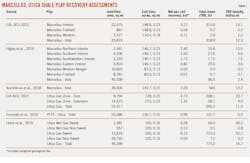
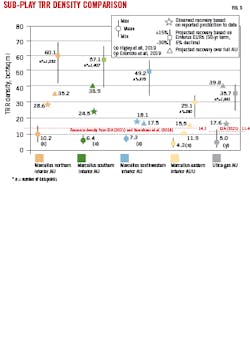
Total volume estimates for plays the size of the Marcellus and Utica can be misleading. Different assessments can use different total play areas. Further, within a large play, regional averaging (even within sub-plays) tends to understate potential in core areas and overstate potential on larger play margins. It is useful, therefore, to translate assessed values into TRR density (TRR/sq mi) (Table 1). For example, rTRR density among recent USGS assessments is 10.5 bcf/sq mi in the northeastern Pennsylvania Marcellus core region.1 EIA’s 2021 assessment equates to 14.1 bcf/sq mi for the large Marcellus Interior sub-play.9 Variation in reported TRR density is more pronounced for the Utica play. Enomoto et al. indicate average recovery of 5 bcf/sq mi, EIA indicates 23.7 bcf/sq mi in the play core, and Hohn et al. assessed 52.2 bcf/sq mi within dry gas sweet spots.3 4 9
Methods
A standard approach to estimating rTRR determines a total play (or sub-play) area, assigns a representative cell size (commonly set to a representative expected well drainage area), subtracts cells already drilled, and assigns a representative per cell recovery to the undeveloped cells. Boswell et al. (2020) take a slightly different approach and use well production data and projections to map uTRR throughout a play.16 From there, an estimate of dTRR is determined (at the scale of counties or smaller) and subtracted from uTRR to arrive at rTRR. The standard approach to GIP assessment includes separate calculation of free gas (via volumetric calculations based on area, total porosity, water saturation, and relevant formation volume factors), and adsorbed gas components. While GIP calculations are generally straightforward, every component is highly uncertain, particularly in the case of unconventional reservoirs.12
The primary input data for this study’s initial assessment of uTRR are well-level ultimate recovery (EUR) estimates obtained through the Enverus DrillingInfo Inc. (DI) best effort-segmented calculations using a 50-year well-life.13 DI EURs were compared against those provided by EIA and Northeast Natural Energy LLC. The most salient difference between these sources is the assumed point at which rate decline moves from hyperbolic to exponential. This cut-off generally reflects onset of lateral well interference, a phenomenon that is not well or easily evaluated but can greatly impact well life and ultimate well productivity.
The DI dataset sets this threshold at 6% annual decline. Northeast Natural Energy (NNE) sets this value at 5%, a typical level within industry.14 EIA’s projections are based on transition at 10% decline.15 Comparison of DI EURs with EIA (for 4,000 Marcellus wells) showed DI EUR to be about 30% greater. Comparison of DI EUR to 900 EUR projections provided by NNE shows them to be 15% lower on average. Consequently, this article reports uTRR values across a range of +15% to -30% in an attempt to capture this uncertainty.
Well-level EURs are converted to estimates of uTRR/sq mi at high spatial resolution.16 The approach carefully screens wells to only those likely to be reliable and representative of future well results. Unreliable data include wells drilled too recently to allow confident extrapolation of EURs (nominally set at 24 months). Horizontal wells drilled before 2013 are deemed unrepresentative because they were completed before the development of new drilling and completion approaches that have enabled a step change in well performance.17 Also excluded as unrepresentative are all vertical wells regardless of vintage.
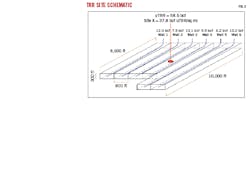
As any individual well may be locally unrepresentative due to well-specific drilling and completion factors, average uTRR density is calculated over a multi-well development site (Fig. 2). In this example six wells drain an area of 1.55 sq mi. The EUR cumulative best estimate of 58.5 equates to a site value of 37.8 bcf/sq mi. This value normalizes EURs for both cumulative well length and measured well spacing. Criteria for a site include multiple wells drilled within a short period of time and at a common well spacing by a single operator with clear intent to drain a specific and contiguous area. By this method, 6,283 pre-screened EURs (tcf/well) were converted to 1,423 distributed uTRR estimates (tcf/sq mi).
Key findings
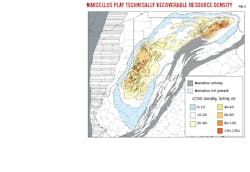
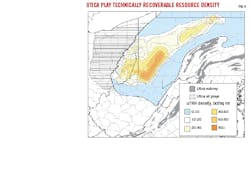
Figs. 3-4 show variable recoverability expected in the future for wells drilled at any location based on uTRR density. Marcellus uTRR density commonly exceeds 50 bcf/sq mi and locally exceeds 100 bcf/sq mi within the play core. Play margins typically contain 20 bcf/sq mi or less. Findings are similar for the Utica.
These resource densities not only greatly exceed recoveries assigned to remaining undrilled acreage in these areas, but also locally exceed calculated GIP, resulting in a physically impossible recovery efficiency (RE) of more than 100%. This phenomenon has been reported previously.12 16
In an attempt to reconcile recoveries, all parameters in the GIP calculation were reevaluated. Most notable is the inclusion of resources expected to contribute to production that are not housed within the specific lithologic formation. In the case of the Marcellus play, this includes substantial resources in overlying Mahantango as well as Genesee and Sonyea formations in northwestern West Virginia where the Tully Limestone is not a fracture barrier. This approach is supported by geochemical evaluation of produced fluids.18
Further increases in GIP are gained by incorporating recent findings related to ultra-low water saturation in the Marcellus.23 Comparing the revised GIPs with the estimated uTRR, estimated RE ranges from ~60% in the play core to ~30% on play margins. In addition to GIP modifications suggested by Pool et al., Blood et al. suggest local strata-bound overpressure may further substantially elevate Marcellus GIP.7 12
The methods used here determine uTRR. To obtain a value for rTRR, dTRR must be estimated. To do this, drilled acreage was estimated on a county (or sub-county) basis and multiplied by estimated local uTRR density. For the Marcellus play, this sums to a total Marcellus dTRR of 180.1 tcf. This value compares favorably with 193.4 tcf reported from production to date (54 tcf) plus reserves (139.4 tcf) in existing wells. Similarly, Utica dTRR is estimated at 41 tcf, compared with 47.3 tcf from production (13.2 tcf) plus reserves (34.4 tcf). These discrepancies would decrease if the higher industry EURs (+15%) were used in the calculations.
Based on estimates of uTRR and dTRR, total rTRR is 693 tcf for the Marcellus play and 684 tcf for the Utica gas play. Of 1,377 tcf total rTRR for both plays, 1,015 tcf occur in Pennsylvania, 259 tcf in West Virginia, 90 tcf in Ohio, and an additional 13 tcf in a portion of New York. Note that there is little data to support interpretations in the eastern (deep) portion of the Utica, but indications are that large areas could obtain recoveries of 100 bcf/sq mi as drilling and completion complications are resolved (OGJ, Jan. 8, 2018). Further drilling in the deep Utica might significantly alter the Utica assessment.
Summary statistics related to evaluation of each play are shown in Table 2 and Fig. 5. Stars represent typical recovery to date from existing developments within each area. Both TRR/sq mi and cumulative production per area greatly exceed values inherent in prior assessments. The situation is similar with respect to the Utica play, with average productivity to date of about 17.6 bcf/sq mi and ultimate productivity that will, on average, exceed 35 bcf/sq mi over the full area of the play.
References
- Higley, D., Enomoto, C., Leathers-Miller, H., Ellis, G., Mercier, T., Schenk, C., Trippi, M., Le, P., Brownfield, M., Woodall, C., Marra, K., and Tennyson, M., “Assessment of undiscovered gas resources in the Middle Devonian Marcellus shale of the Appalachian basin province,” USGS Fact Sheet 2019-3050, October 2019.
- Ikonnikova, S., Smye, K., Browning, J., Dommisse, R., Gherabati, A., Gulen, G., Hamlin, S., Lemons, C., Male, F., McDaid, G., Medlock, K., Scanlon, B., Shuster, M., Tinker, S., and Vankov, E., Final report on update and enhancement of shale gas outlooks, Bureau of Economic Geology at The University of Texas at Austin, 2018.
- Enomoto, C., Trippi, M., Higley, D., Drake, R., Gaswirth, S., Mercier, T., Brownfield, M., Leathers-Miller, H., Le, P., Marra, K., Tennyson, M., Woodall, C., and Schenk, C., “Assessment of undiscovered continuous oil and gas resources in the Upper Ordovician Point Pleasant Formation and Utica Shale of the Appalachian basin province,” USGS Fact Sheet 2019-3044, October 2019.
- Hohn, M., Pool, S., and Moore, J., “Utica play resource assessment,” Patchen D., Carter, K., eds., A Geologic Play Book for Utica Shale Appalachian Exploration, West Virginia Geological and Economic Survey, 2015.
- Zagorski, W., Emery, M., and Ventura, J., “The Marcellus shale play: its discovery and emergence as a major global hydrocarbon accumulation,” Merrill, R. and Sternbach, C., eds., Giant fields of the decade: 2000-2010, AAPG Memoir 114, 2017, pp. 55-90.
- Boswell, R. and Pool, S., “Lithostratigraphy of middle and upper Devonian organic-rich shales in West Virginia,” WVGES Reports of Investigation 35, West Virginia Geological and Economic Survey, 2018.
- Pool, S., Boswell, R., Saucer, J., and Carney, B., “Estimates of natural gas resources and recovery efficiency associated with Marcellus development in West Virginia,” WVGES Reports of Investigation 36, West Virginia Geological and Economic Survey, 2021.
- Boswell, R., “Evaluation of technically recoverable resources in the Marcellus and Utica shale gas plays of the Appalachian basin,” NETL-2021/3213, US-DOE National Energy Technology Lab, Pittsburgh, Pa., 2021.
- EIA, “Assumptions to AEO 2021,” Washington, DC, Feb 23, 2021.
- Engelder, T. and Lash, G., “Marcellus shale play’s vast resource potential creating stir in Appalachia,” American Oil and Gas Reporter, Vol. 51, No. 6, 2008, pp. 76-87.
- Engelder, T., “Marcellus 2008: report card on the breakout year for gas production in the Appalachian basin,” Fort Worth Basin Oil and Gas Magazine, Vol. 20, August 2009.
- Blood, R., McCallum, S., Jalali, J., Douds, A., and Stypula, M., “Towards a more accurate gas-in-place model: reconciling gas storage with gas production in the Marcellus shale, Appalachian basin,” URTEC-2558, SPE/AAPG/SEG Unconventional Resources Technology Conference, Online, Jul. 20-22, 2020.
- Enverus, “Precalculated, proprietary EUR database,” Enverus DrillingInfo Inc., 2019.
- Myers, R., Knobloch, T., Jacot, R., and Ayers, K., “Production analysis of Marcellus shale well populations using public data: what can we learn from the past?” SPE-187505-MS, SPE Eastern Regional Meeting, Lexington, Kentucky, Oct. 4, 2017.
- Cook, T. and Van Wagener, D., “Improving well productivity based modeling with the incorporation of geologic dependencies,” EIA Working Paper Series, Independent Statistics & Analysis, U.S. Energy Information Administration, Oct. 14, 2014.
- Boswell, R., Carney, B., and Pool, S., “Using production data to constrain resource volumes and recovery efficiency in the Marcellus play of West Virginia,” SPE-201752-MS, SPE Annual Technical Conference and Exhibition, Virtual, Oct. 19, 2020.
- Deasy, M., Brown, K., He, J., Lipscombe, W., Ockree, M., Voller, K., and Frantz, J., “Reduced cluster spacing: from concept to implementation,” SPE-191801-MS, SPE/AAPG Eastern Regional Meeting, Pittsburgh, Pennsylvania, Oct. 2018.
- Smith, C., Pool, S., Dinterman, P., Moore, J., Vance, T., Smith, T., Gordon, P., and Smith, M., “Evaluating the liquids potential and distribution of West Virginia’s Marcellus liquids fairway,” URTEC-5540, Uconventional Resources Technical Conference, Houston, Jul. 26-28, 2021.
- Kirschbaum, M., Schenk, C., Cook, T., Ryder, R., Charpentier, R., Klett, T., Gaswirth, S., Tennyson, and M., Whidden, J., “Assessment of undiscovered oil and gas resources of the Ordovician Utica Shale of the Appalachian basin province,” USGS Fact Sheet 2012-3116, September 2012.
- Milici, R., Ryder, R., Swezey, C., Charpentier, R., Cook, T., Crovelli, R., Klett, T., Pollastro, R., and Schenk, C., “Assessment of undiscovered oil and gas resources of the Appalachian basin province,” USGS Fact Sheet FS-999-03, February 2003.
- Coleman, J., Milici, R., Cook, T., Charpentier, R., Kirschbaum, M., Klett, T., Pollastro, R., and Schenk, C., “Assessment of undiscovered oil and gas resources of the Devonian Marcellus Shale of the Appalachian basin province,” USGS Fact Sheet 2011-3092, 2011.
- Douds, A., Stypula, M., and Blood, D., “Measured water saturations in mudstones: preliminary evidence for the introduction of water through drilling and completion practices,” AAPG 90323, AAPG Annual Convention and Exhibition, Pittsburgh, Jul. 23-25, 2018.
The authors
B.J. Carney ([email protected]) is vice president of geoscience and innovation at Northeast Natural Energy in Charleston, W.Va. He holds a BS and MS (2000) in geology and geophysics from Virginia Tech. He is a member of the Society of Exploration Geophysicists, American Association of Petroleum Geologists, Society of Petrophysicists and Well Log Analysts, a past president of the Appalachian Geological Society, and is a member of the WV Water Resources Board.
Ray Boswell ([email protected]) is a geologist at the National Energy Technology Laboratory in Pittsburgh, Pa. Ray holds a Ph.D. (1988) in geology from West Virginia University.
Susan Pool ([email protected]) is a geologist/GIS analyst at the West Virginia Geological & Economic Survey in Morgantown, W.Va. She holds a MS (2013) from Penn State University and two BS degrees (both 1985) from Waynesburg University, Pa.
