Fluid replacement modeling increases reservoir seismic gas response
Muhammad Rizwan Mughal
Gulraiz Akhter
Anees Ahmad Bangash
Quaid-i-Azam University
Islamabad, Pakistan
Analysis of reservoir seismic response with respect to fluid saturation for Lower Goru gas zones in Sawan gas field is carried out through fluid replacement modeling (FRM) to determine overall lateral extent of gas accumulation. Noticeable changes were observed in reservoir rock properties using FRM. Amplitude variation with offset (AVO) response indicated that the reservoir gas sand exhibits a typical Class IV signature. Colored inversion to image acoustic impedance (AI) of the targeted reservoir sand body before and after FRM showed more stratigraphic traps with probable gas sands than initially expected. Seismic reinterpretation in terms of AVO analysis will help predict gas reservoir classification not only for the study region but also in other South Asian regions with similar geological conditions.
FRM has significant impact on seismic studies because it allows the interpreter to generate seismic responses for reservoirs with varying fluid conditions.1-3 In FRM, reservoir pore fluids are replaced from known saturation to new saturation levels, and new theoretical acoustic parameters are calculated. Rock physics is required for better understanding of how elastic properties such as compressional velocity (Vp), shear velocity (Vs), effective density (ρeff), and impedance vary with FRM.4 Rock physics also plays a vital role in highlighting variations in reservoir properties with changes in seismic properties by upscaling reservoir variables.5 For example, rock bulk modulus has large sensitivity to fluid saturation, and it is possible to model seismic properties in the reservoir based on these parameters using Gassmann’s equations.6
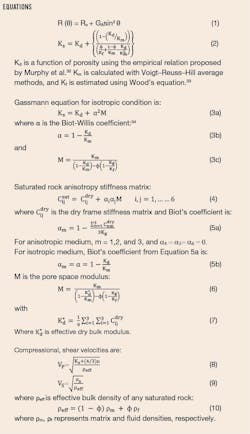
One reliable indicator of hydrocarbon expression in seismic data is AVO. AVO works by varying amplitude (increase or decrease) with offset and can be related to reservoir pore fluid content and rock physical properties.7-9 AVO reflection dependence on offset is based on the effect of upper and lower parts of an interface with different physical properties on seismic amplitudes at the boundaries. The amplitude anomalies of various rock-fluid properties are functions of ρeff, incident angle of seismic waves, and Vp and Vs wave velocities.10 Zoeppritz equations are widely used to study AVO response and to describe relations between reflected, transmitted, and refracted compressed and shear waves for both isotropic and anisotropic media.11 A number of linearized approximations have been given by geoscientists due to the complex form of Zoeppritz equations and lack of intuitive understanding.12-15 The simplified form of the incident angle, using various assumptions, is given by Equation 1.
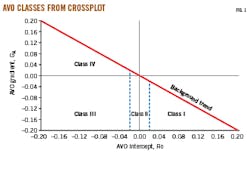
Rutherford and Williams classified AVO curve responses into sectors (Fig. 1) which define gas reservoirs as Class I (high acoustic impedance, AI), Class II (AI near to shale), and Class III (lower AI than the overlying shales).16 Castagna, et al, introduced Class IV for where the normal reflection coefficient is negative and becomes more positive while offset increases with negative intercept (Ro) and positive gradient (GA).8
Fractures are natural features of reservoirs caused by physical diagenesis or rock deformation and can be transversely isotropic with horizontal symmetry (HTI) or azimuthal anisotropic due to vertical open fractures in the rock unit. Amplitude and travel time of seismic waves are affected when travelling through fractured zones. Since elastic properties vary at different azimuths in an HTI medium, primary wave reflection coefficients will also differ when incident on an HTI boundary. Rüger showed that the azimuthal variation of reflection coefficients in HTI media can be accommodated by Equation 1.17 18 The gradient, GA, in Equation 1 is comprised of GAiso (i.e. azimuthal invariable) and GAani (i.e. anisotropic contribution), multiplied by the normal direction of fracture strike and azimuthal angle between the seismic ray path with squared cosine.
FRM is a widely used technique based on application of Gassmann’s equation and calculates new theoretical acoustic parameters (i.e. moduli, densities, and velocities) by changing pore fluid from in situ, initial saturation to new saturation levels. Reservoir seismic response in different pore fluid conditions is estimated and compared with seismic parameters. The effect of fracture density and water saturation is analyzed on reflection coefficient and reflectivity (RC) data as a function of incident angle (q), with azimuth for the gas-bearing sand interval in the reservoir.
Study area
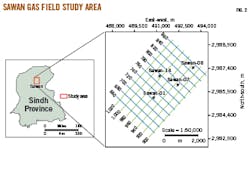
Sawan gas field (Fig. 2) lies in Middle Indus basin between 24º-28º N latitude and 66º E longitude near Pakistan’s eastern border.19 Sawan was discovered in the Thar desert and is considered the most significant hydrocarbon (gas) bearing region between 3,000 and 3,500-m depth.20 The study area is bounded by Sargodha and Mari-Kandkot highs in the north, Jacobabad-Khairpur high in the south, Indian Shield in the east, and fold and thrust belts of Kirthar and Suleiman in the west.21 22 Structural traps were developed by uplifting Khairpur’s High, placing the non-reservoir quality Lower Goru depositional system into the reservoir-quality structural and stratigraphic traps.23 These reservoir intervals developed during sea-level low-stand system tracts in deltaic marine environments. Shale and siltstone deposited at the top of distal sediments when they detached from previous high-stand system tracts.24
Goru has reservoir quality sand intervals and beneath are cretaceous black shales in the Sembar formation which act as the major hydrocarbon source rock in the study region.25
Sembar is thermally matured and deeply buried on the west side of Indus basin where it is more than 260 m thick.26 It is shallower and less mature towards the eastern edge of the basin. A large part of the Cretaceous system is relatively stable because orogenic movement did not affect the deltaic system.27 The Sembar-Goru formation sequence has various progrades, passing from shallow distal to proximal facies.28
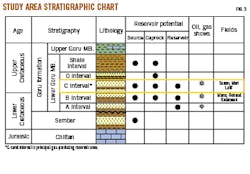
The composition of the upper side of Lower Goru is mainly shale, whereas the lower part is medium-to-coarse-grained sandstones with thin layers of limestone and shale. The subordinate portion of the reservoir interval can be classified into distinct sand intervals: A, B, C, and D (Fig. 3). Petrographically, A and B intervals have mostly quartz-rich arenites whereas major portions of D-interval consist of black shales. The C-sand interval mostly comprises pore-lining iron chlorite cement and partially altered volcanic rock fragments.29 The C-sand intervals can be classified as sublitharenites, lithic arkoses, and litharenites, whereas other diagenetic components include carbonates, glauconite quartz cement, and chlorite cement.30 C-sand covers main gas reservoirs in the research area, with high porosity of about 16% within 3,000-3,500 m. Upper Goru consists of reservoir transgressive shales, siltstones and marl, which act as a regional seal.31
Dataset, methods
Three-dimensional post-stack seismic and wireline log data from four exploration wells (Sawan-01, Sawan-07, Sawan-08, and Sawan-14) provided the basis for this study. Wireline logs include sonic, gamma ray (GR), density (r), resistivity, neutron porosity, density porosity, and 3D post-stack seismic data to characterize and analyze reservoir seismic response due to FRM effects.
Effective elastic properties
Incorporating Gassmann’s equations for isotropic cases provided a relationship between bulk modulus of fluid saturated porous rock (Ks), bulk modulus of dry frame (Kd), bulk modulus of rock matrix (Km), porosity (ϕ), and bulk modulus of pore fluid (Kf), allowing observation of changes in elastic properties caused by fluid replacement. Equation 2 shows the typical form of the Gassmann equation. The equation for isotropic conditions can be written as Equations 3a-c, also called the pore space modulus. A saturated stiffness matrix instead of bulk modulus expresses rock anisotropy from the Gassmann relation, and an additional fluid effect term is added in the dry stiffness matrix with Equations 4-7. The latter equations help execute anisotropic fluid substitution when fluid properties, background solid (matrix), and anisotropic dry stiffness values are known.
When matrix, fluid elastic constants, and densities are known, area velocities as a function of reservoir properties can be predicted from Equations 8-10.
FRM in isotropic media
Reservoir pore fluids change velocity and density seismic properties when their saturation levels change in FRM. FRM was performed on the C-sand reservoir of Sawan-01 and 08 wells based on application of Gassmann’s equations as described above. The initial water saturation levels in Sawan-01 and Sawan-08 are 46% and 51%, respectively. FRM was calculated for pure sandstones to measure sensitivity at modeled 80% gas and 20% water saturation levels. Rock physics cross-plots (Vp versus Vs) delineate effects of FRM and lithology. The Greenberg–Castagna sandstone trend-line (Fig. 1) was used for lithology discrimination.35
FRM in fractured medium
RC data as a function of incident angle (q) with azimuth allowed analysis of of the effects of fracture density and water saturation in the C-sand interval. This investigation also was carried out for Sawan-01 and Sawan-08. Background dry-rock properties Vp, Vs, and r were calculated from Gassmann dry rock modeling. Effective porosity values came from Sawan well petrophysical analysis. Isotropic background properties were added with fracture compliances (i.e. ZT and ZN) to make the medium HTI using Hudson’s approach.36 37 Two main cases were analyzed for fracture density: Case 1, low fracture density (0.05), with C1ij first order correction typically used for small fracture densities (< 0.1), and Case-2, high fracture density (0.15), with second-order C2ij correction.
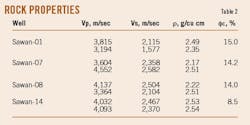
Fluid substitution’s effect on RC also was analyzed for both fracture density cases. The top shale was introduced as the isotropic layer over the modeled HTI medium of the C-sand interval. For simplification, the shale layer was considered as an isotropic overburden without considering fluid substitution, keeping focus on the primary objective to document changes in reflectivity response of azimuthal-anisotropy-related reservoir model properties from fluid substitution. Reservoir modeling was carried out for C-sand intervals with average dry porous rock matrix properties (Table 1), along with overburden shale (Table 2). The models comprised a single set of vertical fractures which were aligned, making the HTI medium symmetrical. The value for the aspect ratio (i.e. short axis of the crack ellipsoid divided by the long axis length) is 0.1, which represents stiff pores in quartz dominated sandstone layers with 90° observation azimuth.
Seismic, well-log parameters
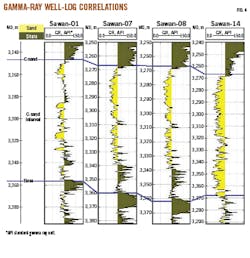
An integrated method established relationships between wells and 3D seismic for identification of stratigraphic surfaces. The key horizons of interest (i.e. Lower Goru, Top, Base of C-sand) are marked based on strong reflection continuity. The reservoir C-sand interval was premapped for spatial distribution in the subsurface by well-log correlation (Fig. 4). For qualitative analysis, gamma ray logs are used to understand lithology discrimination within the reservoir, which are mostly alternating sand and shale. Shale volume comes from the logs. Colored inversion was performed using Sawan-08 to properly image P-impedance of the targeted reservoir sand body before and after FRM. The inverted P-impedance volumes were extracted at a constant 45-ms time slice below the C-sand top horizon, lying within the reservoir zone’s depth.
Gas saturation effect
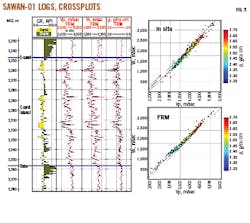
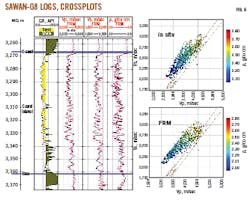
The GR log responses in Fig. 5-6 illustrate sandstone in the C-sand interval. In situ and FRM derived Vp, Vs, and r responses are shown on the logs in black vs. red, respectively. FRM effects on reservoir rock properties can be observed in Vp versus Vs cross-plots. FRM datapoints are shifted towards lower values for Vp and slightly higher values for Vs from in situ measurements. Shear modulus is independent of fluid type and saturation, therefore the increase in Vs is due to change in rock density after applying FRM. Moreover, variations in rock properties after FRM are more prominent towards lower values as compared with in situ condition in both wells. Average changes in sand elastic properties for in situ and after FRM application for both wells are listed in Table 3.
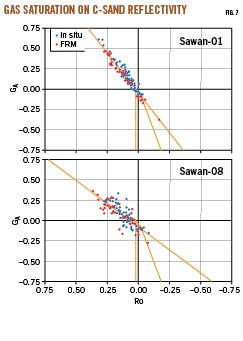
Average calculated velocities and densities for shale and underlying reservoir sand allowed AVO response calculation in situ and with FRM application for a gas-saturated reservoir. Overlaying shale acoustic impedance is higher than either well (Table 4), resulting in negative reflectivity in both wells. Hydrocarbon (gas) present in the reservoir strongly influences seismic parameters, and a cross-plot of Ro and GA for 50 samples (Fig. 7) shows that the top C-sand interface (in situ and FRM) has negative Ro and positive GA. Thus, this is a gas anomaly as seen in Sector II of Fig. 1 and indicates a Class IV reservoir in the study area. There is much overlap in gradient direction between in situ C-sand and FRM C-sand, however, cross-plotting shows deviation of FRM C-sand from background trend. The change in Ro and GA in both the wells is listed in Table 5.
Colored inversion analysis
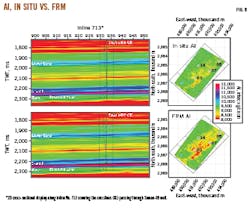
The AI volume, along with the corresponding vertical seismic section, generated through colored inversion in situ and after FRM shows that AI decreases after FRM and suggests further lateral extent of hydrocarbon bearing zones (Fig. 8). Sawan-01, Sawan-07, and Sawan-08 are in low AI zones, however, Sawan-14 is situated where AI is relatively high, corresponding to its comparatively small gas production and indicating that the well is not in an ideal location. Interpretation of the results suggests that the study region has more stratigraphic traps with probable gas sands than initially expected, and this approach can help further predict hydrocarbon bearing sand channels.
HTI media fracture density
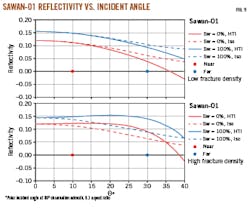
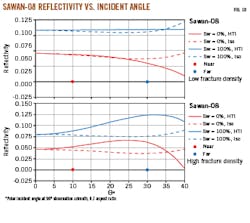
Figs. 9-10 show reflection coefficient responses with 0% (dry) and 100% (wet) water saturation levels for Sawan-01 and Sawan-08, with respect to polar incident angle. Cases 1 and 2 (low and high fracture density, respectively) were examined in each well with either isotropic (iso) or anisotropic (HTI) fractures. Increased water saturation increased the magnitude of RC data curves in Sawan-01. Anisotropic AVO gradient estimations showed higher values for wet than dry cases. High fracture density increases RC compared with low fracture density.38 The differences in the magnitude of isotropic and anisotropic RC curves is more pronounced at far angles for Case 1 and near-to-far angles for Case 2. Azimuthal variations of RC are higher with saturation.
Changes in anisotropic AVO gradients between 100% saturated and dry states are similar for low- and high-fracture density cases of HTI media unlike anisotropic RC curves, which increase with fracture density. Both AVO gradients and RC curves increase with saturation of the porous HTI medium. Therefore, saturation effects have more influence on anisotropic parameters than fracture density.
Acknowledgment
The authors would like to thank the Directorate General of Petroleum Concessions, Pakistan, for the release of 3D seismic and well log data.
References
- Smith, T. M., Sondergeld, C. H., and Rai, C. S., “Gassmann fluid substitutions: A Tutorial.” Geophysics, Vol. 68, No. 2, March-April 2003, pp. 430-440.
- Rizwan, M., Akhter, G., Mustafa, A., Nisar, U. B., and Ashfaq, K., “Amplitude versus offset (AVO) modelling and analysis for quantitative interpretation of porosity and saturation: A case study for Sawan gas field, middle Indus basin, Pakistan,” Geofísica Internacional, Vol. 57, No.2, April 2018, pp.151-160.
- Su, Y., Tao, Y., Wang, T., Chen, G., and Li, J., “AVO attributes interpretation and identification of lithological traps by prestack elastic parameters inversion – A case study in K Block, South Turgay Basin,” 80th Annual International Meeting, Society of Exploration Geophysicists, Expanded Abstracts, April 2010, pp. 439 – 444.
- Grana, D., Pirrone, M., and Mukerji, T., “Quantitative log interpretation and uncertainty propagation of petrophysical properties and facies classification from rock-physics modeling and formation evaluation analysis,” Geophysics, Vol. 77, May-June 2012, pp. 45–63.
- Avseth, P., Mukerji, T., and Mavko, G., “Quantitative Seismic Interpretation: Applying Rock Physics Tools to Reduce Interpretation Risk,” Cambridge University Press, Cambridge, UK, 2005.
- Gassmann, F., “Elastic waves through a packing of spheres,” Geophysics, Vol. 16, May 1951, pp. 673–685.
- Batzle, M.L., Han, D.H., and Hofmann, R., “Optimal hydrocarbon indicators,” Society of Exploration Geologists, Tulsa, Okla., SEG Technical program expanded abstracts, 2001, pp. 1697–1700.
- Castagna, J.R., Swan, H.W., and Foster, D.J., “Framework for AVO gradient and intercept interpretation,” Geophysics, Vol. 63, No. 3, May-June 1998, pp. 948–956.
- Ostrander, W.J., “Plane-wave reflection coefficients for gas sands at non normal angles of incidence,” Geophysics, Vol. 49, No. 10, October 1984, pp. 1637–1648.
- Mavko, G., Mukerji, T., and Dvorkin, J., “The Rock Physics Handbook; Tools for Seismic Analysis of Porous Media,” Cambridge University Press, Cambridge, UK, 2009.
- Zoeppritz, K., “On the Reflection and Propagation of Seismic Waves,” Göttinger Nachrichten, Vol. IIb, 1919, pp. 66–84.
- Gray, D., Goodway, W., and Chen, T., “Bridging the gap: using AVO to detect changes in fundamental elastic constants,” Society of Exploration Geologists, Tulsa, Okla., SEG Technical program expanded abstracts, 1999, pp. 852-855.
- Fatti, J.L., Vail, P.J., Smith, G.C., Strauss, P.J., and Levitt, P.R., “Detection of gas in sandstone reservoirs using AVO analysis: a 3-D seismic case history using the geostack technique,” Geophysics, Vol. 59, No. 9, September 1994, pp. 1362–1376.
- Shuey, R.T. “A simplification of the Zoeppritz equations,” Geophysics, Vol. 50, No. 4, April 1985, pp. 609–614.
- Aki, K., and Richards, P.G., “Quantitative seismology: theory and methods.” W. H. Freeman, San Francisco, 1980, pp. 558-932.
- Rutherford, S. and Williams, R., “Amplitude-versus-offset variations in gas sands,” Journal of Geophysics, Vol. 54, No. 6, June 1989, pp. 680–688.
- Rüger, A., “Variation of P-wave reflectivity with offset and azimuth in anisotropic media,” Geophysics, Vol. 63, No. 3, June 1998, pp. 935–947.
- Rüger, A., “Reflection coefficients and azimuthal AVO analysis in anisotropic media,” Society of Exploration Geophysicists, Tulsa, Okla., Geophysical Monograph Series, No. 10, 2002.
- Zaigham, N. and Mallick, K., “Prospect of hydrocarbon associated with fossil-rift structures of the southern Indus Basin, Pakistan,” AAPG Bulletin 2000, Vol. 84, No. 11, November 2000, pp. 1833–1848.
- Ahmed, A.R., Ahmad, M., and Rehman, A., “Comparison of Core/Log and Well Test Permeabilities – A Closer Look ‘Sawan Tight Sands’,” SPE-142836-MS, SPE/PAPG Annual Technical Conference, Islamabad, Pakistan, Nov. 10-11, 2010.
- Afzal, J., Kuffner, T., Rahman, A., and Ibrahim, M., “Seismic and well-log based sequence stratigraphy of the early Cretaceous, Lower Goru “C” sand of the Sawan gas field, middle Indus Platform, Pakistan,” Society of Petroleum Engineers Annual Technical Conference, Islamabad, Pakistan, Nov. 17-18, 2009.
- Kadri, I. B., “Petroleum Geology of Pakistan: Pakistan Petroleum Limited,” Graphic Publishers, Karachi, Pakistan, 1995.
- Ahmad, N. and Chaudhry, S., “Kadanwari Gas Field, Pakistan: a disappointment turns into an attractive development opportunity,” Petroleum Geoscience, Vol. 8, No. 4, December 2002, pp. 307–316.
- Ahmad, N., Fink, P., and Sturrock, S., “Sequence stratigraphy as predictive tool in lower Goru fairway, Lower and Middle Indus Platform, Pakistan,” PAPG-SPE Annual Technical Conference, Islamabad, Pakistan, Oct. 8-9, 2004.
- Ali, A., Alves, T.M., Saad, F.A., Ullah, M., Toqeer, M., and Hussain, M., “Resource potential of gas reservoirs in South Pakistan and adjacent Indian subcontinent revealed by post-stack inversion techniques,” Journal of Natural Gas Science and Engineering, Vol. 49, January 2018, pp. 41–55.
- Wandrey, C.J., Law, B.E., and Shah, H.A., “Sembar Goru/Ghazij composite total petroleum system Indus and Sulaiman-Kirthar geologic Provinces, Pakistan and India,” US Geological Survey, Geological Survey Bulletin 2208-C, 2004.
- Abbas, S.T., Mirza, K., and Arif, S.J., “Lower Goru Formation-3D Modeling and Petrophysical Interpretation of Sawan Gas Field, Lower Indus Basin, Pakistan,” The Nucleus, Pakistan, Vol. 52, No. 3, 2015, pp. 138–145.
- Khalid, P., Qayyum, F., and Yasin, Q., “Data-Driven sequence stratigraphy of the cretaceous depositional system, Punjab Platform, Pakistan,” Surveys in Geophysics Vol. 35, May 2014, pp. 1065–1088.
- Azeem, T., Yanchun, W., Khalid, P., Xueqing, L., Yuan, F., and Lifang, C., “An application of seismic attributes analysis for mapping of gas bearing sand zones in the Sawan gas field Pakistan,” Acta Geodaetica et Geophysica, Vol. 51, No. 4, December 2016, pp. 723-744.
- Munir. K., Iqbal. M.A., Farid. A., and Shabih. S.M., “Mapping the productive sands of Lower Goru Formation by using seismic stratigraphy and rock physical studies in Sawan area, southern Pakistan: A case study,” Journal of Petroleum Exploration and Production Technology, Vol. 1, No. 1, May 2011, pp. 33–42.
- Berger, A., Gier, S., and Krois. P., “Porosity-preserving chlorite cements in shallow-marine volcaniclastic sandstones: evidence from cretaceous sandstones of the Sawan gas field, Pakistan,” American Association of Petroleum Geologists Bulletin, Vol. 93, No. 5, March 2009, pp. 595–615.
- Murphy, W., Reischer, A., and Hsu, K. “Modulus decomposition of compressional and shear velocities in sand bodies,” Geophysics, Vol. 58, No. 2, February 1993, PP. 227-239.
- Wood, A. B., “A textbook of sound,” G. Bell and sons, London, 1941.
- Biot, M. A. and Willis, D. G., “The elastic coefficients of the theory of consolidation,” Journal of Applied Mechanics, Vol. 24, 1957, pp. 594–601.
- Greenberg, M. L. and Castagna, J. P., “Shear‐wave velocity estimation in porous rocks: theoretical formulation, preliminary verification and applications,” Geophysical Prospecting, Vol. 40, No. 2, February 1992, pp. 195-209.
- Hudson, J., “Overall properties of a cracked solid,” Mathematical Proceedings of the Cambridge Philosophical Society, Vol. 88, No. 2, September 1980. pp. 371–384.
- Hudson, J., “Wave speeds and attenuation of elastic waves in material containing cracks,” Geophysics Journal International, Vol. 64, No. 1, January 1981, pp. 133–150.
- Anwer, H.M., Alves, T.M., Ali, A., and Zubair,, “Effects of sand-shale anisotropy on amplitude variation with angle (AVA) modelling: The Sawan gas field (Pakistan) as a key case-study for South Asia’s sedimentary basins,” Journal of Asian Earth Sciences, Vol. 147, No. 1, October 2017, pp. 516–531.
The authors
Muhammad Rizwan Mughal ([email protected]) has been working as a research associate at COMSATS University, Islamabad, since 2014. He holds an MS in geophysics (2011) and is a PhD candidate at Quaid-i-Azam University (QAU), Islamabad. He is a member of Society of Exploration Geophysicists and Pakistan Association of Petroleum Geoscientists.
Gulraiz Akhter ([email protected]) is a professor at QAU, Islamabad. He has also served as chairman, department of earth sciences, QAU. He holds an MS in Geophysics (1984) and a PhD from QAU. He is a member of Pakistan Geophysical Network (PGN).
Anees Ahmad Bangash ([email protected]) has been an assistant professor in the department of earth sciences at QAU since 2000. He holds an MS in geophysics (1995) and a PhD in geophysics (2017) from QAU. He is a member of PGN.
