Optimized drilling saves time in Persian Gulf
Rasool Khosravanian
Bernt Sigve Aadnøy
University of Stavanger
Norway
A comprehensive study of new phases for Statoil South Pars phase development optimized drilling times. Using South Pars drilling history in Phases 6, 7, and 8 as a guide, different approaches were evaluated to improve and optimize drilling times using Monte Carlo simulations (MCS) and program evaluation review techniques (PERT). Conventional drilling, batch drilling, and casing-while-drilling were compared. Batch drilling saved 5 days/well over conventional drilling, and casing-while-drilling saved an additional 4 days/well.
South Pars field
South Pars is in the Iranian section of the northern Persian Gulf and was discovered in 1990 by well SP-01, which encountered gas. The field was confirmed by drilling SP-02, SP-03, and SP-04 from 1991-92. Nineteen additional appraisal, delineation, and production wells were drilled 1998-2010. Ultimately, 79 development wells were drilled in several areas or phases.
South Pars is the world’s largest known gas field and is part of the large NNE-SSW trending Qatar-Fars Arch. The South Pars gas reservoir is comprised of the Kangan formation and Upper Dalan member of Dehram group. These carbonate formations were deposited in a shallow marine environment during a general regional marine transgression that began in middle Permian and lasted until early Triassic. Within these reservoirs (equivalent to Khuff formation in Arabian nomenclature) are main producing zones K1 through K4, from top to bottom, respectively. They are separated by anhydritic layers. A massive anhydrite body, known as Nar Member, separates K4 from the underlying K5 member which exhibited poor reservoir characteristics in SP-01 and SPD12B-08. Dashtak formation is known as a good seal for these reservoirs.
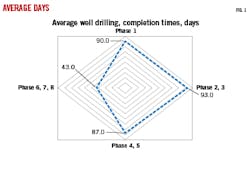
Historically, Statoil improved drilling in South Pars with advanced polycrystalline diamond compact (PDC) bit technology and ultrahigh-powered steerable motors combined with optimizations for well trajectory, cementing, and drilling fluids. Average drilling and completion times were 93 days for Phases 2 and 3, which declined to 87 days for Phases 4 and 5 (Fig. 1), against an original 72 day/well budget estimate.1
New generation hybrid drill bits improved penetration rates and reduced well construction costs through faster and more durable drilling performance. Using these bits, the average dropped to 43 days/well in Phases 6-8, and average drilling times within these phases typically improved 2.5-8 days/well.
Drilling plan, hazards
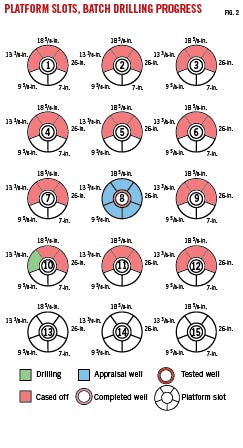
Fig. 2 illustrates an in-process batch drilling plan for future South Pars phases, beginning with Phase 11, with 15 platform slots including 1 appraisal well and 11 production wells/phase. The drilling jacket has been installed, and the appraisal well is located on Slot 8 to better define reservoir top, geometry, petrophysical properties distribution, lateral and vertical continuity, gas-water contact depth, and estimate productivity. Reservoir fluids will be characterized by logging, coring, and testing.
The primary objective of surface casing is shutoff and sealing the highly fractured dolomitic Jahrum formation. Planned setting depth for 18 5/8-in. casing inside the 24-in. hole is ±20 m TVD into Ilam formation. The section will be drilled with two bottom hole assemblies (BHA) and a measurement while drilling (MWD) directional tool.
The main objective of intermediate casing is isolation of the oil bearing Dariyah formation and the potentially weak Fahliyan formation. Setting depth for 13 3/8-in. casing inside the 16-in. hole is ±20 m TVD into Hith anhydrite formation.
The main objectives of Production Casings 1 and 2 are isolation and sealing of geopressured or unstable fractured shale sections in Aghar and Upper, Lower Sudair shales. Production casing is 10 ¾-in. × 9 5/8-in. inside a 12 ¼-in. hole. The casing shoe will be set ±20 m TVD into the Upper Kangan formation. Two BHAs will drill this section with a slim hole assembly providing optimum hole cleaning while limiting lost circulation from increased mud weight.
For the production liner, an 8 ½-in. hole will be drilled to 30 m MD after target, which is the lowest perforation point, and 30 m minimum above the estimated gas-water contact (GWC). However, GWC varies across the field and will be determined for each well. The section will be completed with cemented 7-in. liner.
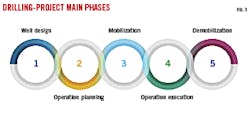
For drilling time estimates, elements of the workflow included well design, operation planning, mobilization, operation execution, and demobilization (Fig. 3).
MCS, conventional drilling
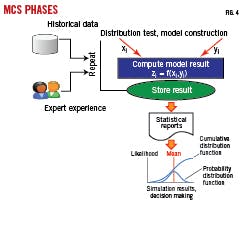
MCS is based on procedures defined by Williamson et al. and has four steps:2
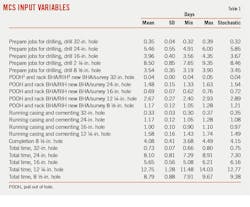
With a range of possible input values, output will span a range of estimates with likelihood probabilities. MCS process and workflow with batch and conventional drilling are shown in Fig. 4.
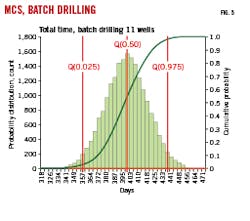
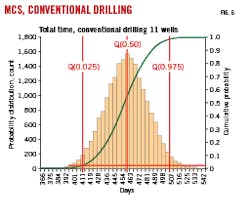
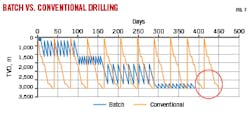
Analysis shows 396 days mean time for batch drilling and 455 days for conventional drilling (Fig. 5-6). Fig. 7 shows drilling time per section for both approaches. Batch drilling showed 15% savings over conventional drilling with respect to time versus depth (red circle).
PERT
The most common drilling project management tools are MCS, Gantt chart, and PERT. PERT is used when there is an upper degree of uncertainty about individual activity time estimates. Its advantages are in facilitating large project planning, identifying critical paths, aiding activity analysis, and improving project coordination.
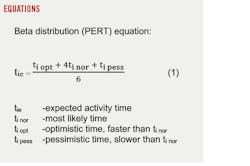
PERT uses a list of individual activity time probabilities to account for all project time. This technique uses three parameters:
- ti nor, most likely time.
- ti opt, optimistic time, faster than ti nor.
- ti pess, pessimistic time, slower than ti nor.
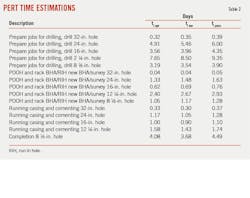
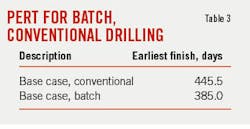
Table 2 shows estimates of these times for batch drilling. Expected activity time, tie, is calculated with Equation 1. Earliest finish (EF) times for conventional and batch drilling, obtained by summing tie for 11 wells, are shown in Table 3.
PERT’s advantages over MCS are simplicity and the ability to use it with little knowledge of statistical tools. Studies have shown better precision and comprehensiveness of MCS, but for this study MCS and PERT predictions were comparable. PERT EF times were 10 days under MCS mean times for the collective 11 wells.
Drilling time improvement
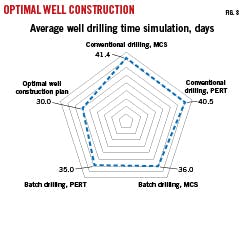
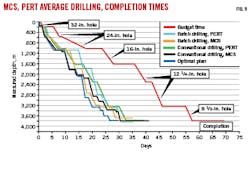
Estimated conventional drilling time per well is 41.4 days (mean) by MCS and 40.5 days (EF) by PERT. For batch drilling, time per well is estimated at 36 days by MCS and 35 days by PERT, which approaches the 30-day optimal plan for well construction (Fig. 8). Fig. 9 shows average drilling times per section for all simulations.
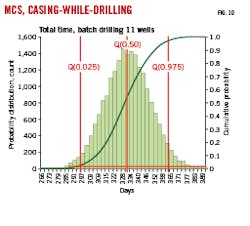
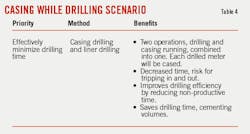
Further improvement to drilling times used casing-while-drilling in which two main operations are combined and cementing costs are saved by reducing annulus volume. There is no need for separate casing or liner runs as all borehole sections are drilled and cased, ready for cement. This scenario results in safer drilling operations by requiring fewer people on the rig and less pipe handling than routine drilling. In addition, with casing constantly on bottom, non-productive time due to wellbore instability is decreased. Table 4 lists advantages of this technique and Fig. 10 shows mean drilling times reduced to 327 days, an average reduction of 6 days/well.
References
- Johannessen, B. and Vestvik, J., “Smart Operations: Cheap? High-tech? Or Simply The Best Fit? Optimized Drilling Solutions on The South Pars Field, Offshore Iran,” SPE-94146-MS, SPE Europec/EAGE Annual Conference, Madrid, June 13-16, 2005.
- Williamson, H.S., Sawaryn, S.J., and Morrison, J.W., “Monte Carlo Techniques Applied to Well Forecasting: Some Pitfalls,” SPE-89984-PA, SPE Drilling & Completion, Vol. 21, No. 3, September 2006.
The authors
Rasool Khosravanian ([email protected]) is a post-doctoral fellow in the Department of Petroleum Engineering, University of Stavanger, Norway. He holds a MSc. (2003) and Ph.D. (2009) in industrial engineering from Iran University of Science and Technology (IUST). He is a member of the society of petroleum engineers (SPE).
Bernt Sigve Aadnøy ([email protected]) is professor of petroleum engineering at the University of Stavanger, Norway. He received a BSc. (1975) in mechanical engineering from Stavanger technology, a BSc. (1978) in mechanical engineering from the University of Wyoming, an MSc. (1979) in control engineering from the University of Texas, and a Ph.D. (1987) in geomechanics from the Norwegian Institute of Technology. He was the recipient of the 1999 SPE Drilling Engineering Award and is a 2015 SPE/AIME honorary member and a 2015 SPE distinguished member.
