Buoyancy model prompts more San Andres drilling
J.K. Dietrich
Dietrich & Assoc.
Pasadena, Calif.
A new type of buoyancy model can be used to understand the source of residual oil zones (ROZs), both thick and thin, and help determine the likelihood that economically viable recoverable oil resides in transition zones (TZs) of imbibition reservoirs.
Application of a buoyancy and breach model will fill a void in reservoir characterization. It will help distinguish between TZs and ROZs: the first of which allows application of primary and secondary (waterflooding) oil recovery methods and the second of which requires more difficult tertiary CO2-enhanced oil recovery (EOR) projects.
Next generation CO2 EOR projects are undertaken with the hope of recovering tertiary oil while sequestering and storing a greenhouse gas. This activity assumes tolerable risks of CO2 containment, given the widely-advanced waterflood model, which is based on a rare, cataclysmic tectonic event, as the source of Permian basin ROZs. But breached seals caused by increased buoyancy pressure, either from depressurizing the upper ROZs and forming a buoyant free gas phase, or simply injecting CO2 that is less dense than the reservoir oil, may pose the real risks.
The recent surge in drilling TZs overlying ROZs in the San Andres formation of the Permian basin came late and followed a chance demonstration of TZ’s oil productive potential, notwithstanding calls made nearly 20 years earlier that recoverable hydrocarbons are likely to be held in TZs of imbibition reservoirs, including those of the Permian.1-4
This early insight was based on understanding that an ROZ and its overlying TZ form by vertically acting buoyancy in leaking reservoirs. Two other models were introduced at nearly the same time to explain the ROZ’s source. One is built on a concept of oil-water contact tilting and gravity-controlled migration of oil beneath spill points, the other relies on viscous forces from tectonic uplift, changed hydrodynamic flow within aquifers, and lateral sweep of oil columns.5 6
The lateral sweep model has been heavily publicly funded and promoted for application in the Permian basin, where it is known as “Mother Nature’s waterflood.”7 8 Unlike a buoyancy model, it is a model in which little, if any, distinction is made between a TZ and an ROZ.
The abnormally thick nature of the San Andres ROZs led earth scientists away from considering buoyancy concepts as their source.9
Residual oil zones
Residual oil zones are beneath many oil reservoirs worldwide, suggesting that these reservoirs once contained much larger oil volumes. Oil migrated out of these reservoirs, causing the oil-water contact and paleo free water levels (zero capillary pressure level, ZCPL) to rise, and placing the reservoir in imbibition rather than drainage mode. In these reservoirs, saturation profiles must be characterized by imbibition capillary pressure curves, rather than drainage curves, as routinely assumed. Imbibition curves have lower water saturations in the productive interval and significantly smaller transition zones than predicted by drainage curves.
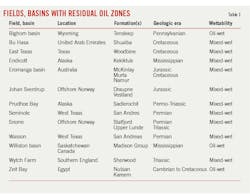
Zeit Bay field in Egypt, Wytch Farm in the UK, Bu Hasa in UAE, Endicott in Alaska, and Johan Sverdrup and Snorre offshore Norway, are but a few of many fields known to hold ROZs (Table 1). In each case the rocks are either mixed-wet or oil-wet. These occurrences and the absence of ROZs in water-wet formations have led to the concept of a simple buoyancy model; a model which relies on dropout of heavy-end hydrocarbon fractions from the liquid hydrocarbon phase over time (Table 1). This dropout changes the paleo condition from water-wet (i.e. brine-filled) to mixed-wet or oil-wet, as found at discovery.
In each of these reservoirs, fluids appeared to be in gravity-capillary pressure equilibrium at time of discovery, indicating something other than Mother Nature’s waterflood as an explanation for ROZ formation. A mechanism that would explain a gravity-dominated breach of a caprock seal, and its subsequent reseal, for the origin of a ROZ is reminiscent of the natural increase in buoyancy pressure that occurs when the liquid hydrocarbon phase loses heavy fractions via heavy-end dropout.
Heavy-end dropout
Heavy-end dropout debuted as part of a modeling technique for design of CO2-EOR projects and for interpretation of early CO2 injectivity tests, most of which were performed in the West Texas San Andres reservoirs using a CO2-flood simulator designed and owned by Todd, Dietrich & Chase Inc.10 The liquid hydrocarbon phase in the simulator consists of up to six components, the heaviest of which is often used to represent asphaltene, which precipitates as a function of CO2 concentration.
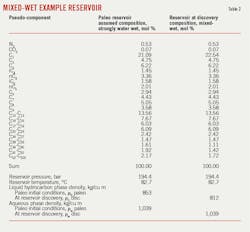
This early numerical modeling approach followed publication of a pore-level concept describing how mixed-wettability might form and evolve in reservoir rock initially filled with brine.11 Later research demonstrated that wettability of originally water-wet mineral surfaces may be reversed by adsorption of polar organic compounds in crude oils, the highest concentration of which is found in the heavy ends of crudes, particularly in the asphaltene and resin fractions.12 13 Table 2 shows the change in liquid hydrocarbon phase density caused by only a small change in mol fractions of heavy ends.
Awareness of heavy-end dropout history and wettability triggered the concept of a buoyancy and breach model, one that is shown here to explain the surge of drilling activity in the transition zones of the San Andres.
Buoyancy, breach model
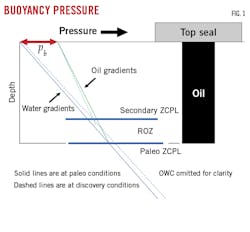
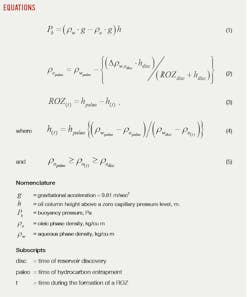
Buoyancy pressure is the difference between the pressure at the bottom of an oil column pushing up on it and the pressure at the top pushing down (Equation 1). Buoyancy pressure is zero at ZCPL and increases to its maximum at the top of a hydrocarbon column just below a trapping seal (Fig. 1). The difference in pressure between water phase and oil phase at any point above ZCPL is the buoyant force at that point.
An analogy for the upward buoyant or driving force of a static oil column is the upward force generated by a wooden two-by-four vertically trapped in a tank of water. The buoyant force at the top of the board is directly proportional to the length of the two-by-four. If the length of the vertical column of oil were increased, the buoyant force at the top of the oil column would be increased.14 Also, in the two-by-four example, buoyant force increases with lower density of the two-by-four.
Given heavy-end dropout, liquid hydrocarbon phase density will decrease. The greater density difference between water and oil increases buoyancy pressure acting at the top seal. Where buoyancy pressure is sufficiently high, petroleum will leak through the top seal of the trap until buoyancy pressure re-equilibrates to its threshold pressure and the caprock reseals. As oil density continues to decrease, the caprock episodically breaches and reseals, in a natural equilibration process that returns a perturbed, ever more buoyant system to equilibrium with the buoyancy threshold pressure of the caprock, which is assumed to remain constant.
The caprock buoyancy pressure at time of discovery will be the same as that at the time of entrapment. Assuming invariant brine density, an estimate of paleo hydrocarbon phase density can be made using Equation 2. In this proposed model, growth of the ROZ is a function of decreasing liquid hydrocarbon phase density, which in turn is a function of time (Equations 3-5).
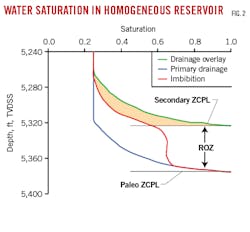
The saturation-height profile before leakage starts should be set using the estimate for the paleo liquid hydrocarbon phase density (Equation 2) and a drainage capillary pressure curve pinned to the paleo ZCPL (blue curve in Fig. 2).
Researchers long ago offered graphic techniques for estimating the shape of imbibition capillary pressure curves which characterize the saturation profile within an imbibition reservoir. Despite this shared understanding, the standard modeling approach has been to use a drainage capillary pressure curve to describe saturation in imbibition reservoirs (green curve in Fig. 2).
Saturation models, based on drainage capillary pressure curves which assume zero capillary pressure at the base of the ROZ, provide reasonable estimates of original water saturation in the productive interval. However, the models overestimate mobile oil in the ROZ. Conversely, capillary pressure models which assume zero capillary pressure at the base of the productive interval will underestimate original oil in place.
Gradual rise of paleo ZCPL to the ZCPL observed at time of reservoir discovery will alter the saturation-height profile established during primary drainage. The rise of paleo ZCPL was simulated using simple one-dimensional gravity-stable displacement by specifying aquifer influx at the base of a reservoir model and hydrocarbon leakage at the top. A standard capillary pressure hysteresis model was used during this simulation to move from a primary drainage curve to a series of spontaneous imbibition capillary pressure curves.15
Results extracted from the simulation output files are shown in red in Fig. 2. The difference between red and green curves above the secondary ZCPL represents oil reserves that standard modeling practices have missed. These reserves could be the source of much of the produced oil in the San Andres horizontal play and in many of the San Andres next generation CO2-EOR projects.
Results
Application of Equation 2 suggests that paleo oil densities were commonly at least 10% greater than those encountered at time of discovery of the mixed or oil-wet reservoirs listed in Table 3. The densities shown in Table 3 can be used to calculate the rise in buoyancy pressure that would have occurred at the top seal in the absence of seal breach. An increase of about 20% would have occurred at Bu Hasa, Johan Sverdrup, and Wytch Farm and an increase of about 30% at Seminole and Wasson.
The caprock of San Andres reservoirs consists of dense anhydritic dolomites with low ductility that will fracture when pore pressure is greater than both its minimum stress and tensile strength, then reseal when pressure reduces and fractures close. Irreversible buoyancy pressure increases of 30% at the top seal would appear not to have been reached, owing to episodic breaching, pressure release, and resealing of the caprock.
The San Andres reservoirs listed in Table 3 contain saturated oil and primary gas caps. The primary gas caps formed as heavy-end dropout led to breaching and temporary loss of pressure due to lagging aquifer influx. If a gas cap forms, the oil column must significantly shrink to maintain the same buoyancy pressure at the top seal. Given the buoyancy and breach model, thicker gas caps mean thicker ROZs. The reservoirs at Bu Hasa, Johan Sverdrup, and Wytch Farm contain highly under-saturated oil. There were no primary gas caps in those reservoirs and their ROZs are relatively thin (Table 3).
Recent Permian basin activity supports the concept that transition zones may hold more oil than previously thought.16 Researchers at Texas Tech University are finding that producing wells completed in the upper portion of San Andres ROZs are “unlikely to be true ROZ producers and are more likely to be completed in the transition zone,” and Permian basin operators are continuing to express interest in drilling or waterflooding San Andres TZs.17-19
The buoyancy and breach model addresses the persisting, fundamental problem of describing oil and water saturation distributions in the basal portions of imbibition reservoirs, including those of the Permian basin’s San Andres and Grayburg reservoirs where most US oil reserves are located. The model also brings an awareness of the instability of caprock seals and the dynamic nature of most hydrocarbon traps.
Acknowledgment
The author thanks Alton Brown, who introduced the concept of oil-water contact tilting and gravity-controlled migration of oil beneath spill points to explain the source of Permian basin ROZs, for his time and encouragement regarding publication of this article.
References
- Rassenfoss, S., “New Permian Oil Play Requires Pumping and Persistence,” SPE-0217-00028-JPT, Journal of Petroleum Technology, Vol. 69, #2, February 2017, pp. 28-31.
- Adams, S.J., “New Insight into Eromanga Basin Oil Saturations,” SPE-77886, Society of Petroleum Engineers Asia Pacific Oil and Gas Conference and Exhibition, Melbourne, Australia, Oct. 8-10, 2002.
- Adams, S., “Modeling Imbibition Capillary Pressure Curves,” SPE-84298, Society of Petroleum Engineers Annual Technical Conference and Exhibition, Denver, Colo., Oct. 5-8, 2003.
- Lucia, F.J., “San Andres and Grayburg Imbibition Reservoirs,” SPE-59691-MS, Society of Petroleum Engineers Permian Basin Oil and Gas Recovery Conference, Midland, Tex., Mar. 21-23, 2000.
- Brown, A., “Effects of Hydrodynamics on Cenozoic Oil Migration, Wasson Field Area, Northwestern Shelf of the Permian Basin,” West Texas Geological Society Fall Symposium, Viveiros J.J. & Ingram S.M. eds, Pub 01-110, 2001, pp. 133-142.
- Lindsay, R.F., “Meteoric Recharge, Displacement of Oil Columns and Development of Residual Oil Intervals in the Permian Basin,” West Texas Geological Society Fall Symposium, Viveiros J.J. & Ingram S.M. eds, Pub 01-110, 2001, p. 189.
- Melzer, L.S., Kuuskraa, V.A. and Koperna, G.J., “The Origin and Resource Potential of Residual Oil Zones,” SPE-102964, Society of Petroleum Engineers Annual Technical Conference and Exhibition, San Antonio, Tex., Sept. 24-27, 2006.
- Trentham, R. and Melzer. S., “San Andres: The New Frontier-Horizontals, Residual Oil and Core Workshop,” WTGS Short Course, Mar. 2, 2017.
- Melzer, S., “Mother Nature’s Waterflood,” personal communication, J.K. Dietrich, Mar. 24, 2020.
- Todd, M.R. and Chase, C.A., “Numerical Simulation of CO2 Flood Performance,” SPE-11595-PA, Society of Petroleum Engineers Journal, Vol. 25, No. 3, 1984.
- Salathiel, R.M., “Oil Recovery by Surface Film Drainage in Mixed-Wettability Rocks,” Journal of Petroleum Technology, October 1973, pp. 1216-1224.
- Clementz, D.M., “Alteration of Rock Properties by Adsorption of Petroleum Heavy Ends: Implications for Enhanced Oil Recovery,” SPE-10683-MS, Society of Petroleum Engineers Enhanced Oil Recovery Symposium, Tulsa, Okla., Apr. 4-7, 1982.
- Dubey, S.T. and Waxman, M.H., “Asphaltene Adsorption and Desorption from Mineral Surfaces,” SPE-18462-PA, Society of Petroleum Engineers Reservoir Engineering, Vol. 6, No. 3, 1991.
- Schowalter, T.T., “Mechanics of Secondary Hydrocarbon Migration and Entrapment, A Pamphlet,” Amazon Books, Jan. 1, 1979.
- Killough, J.E. Reservoir Simulation with History-Dependent Saturation,” SPE-5106-PA, Society of Petroleum Engineers Journal, Vol. 16, No. 1, 1976, pp. 20–25.
- Dietrich, J.K., “Reservoir Modeling-Pitfalls in Practice and Projects Gone Wrong. Recurrent Need for More Wells, Transition Zone Development,” ISBN: 9781697429853, Amazon Books, Chapter 9, 2019.
- Jamali, A., Ettehadtavakkol, A. and Watson, M., “Depressurizing Permian Basin San Andres Residual Oil Zones: A Feasibility Study,” SPE-187482, Society of Petroleum Engineers Liquids-Rich Basins Conference - North America, Midland, Tex., Sept. 13-14, 2018.
- Thomas III, D.M., Chief Executive Officer of Trey Resources Inc., personal communication, March 10, 2017.
- Stilwell, S., President of Walsh Petroleum Inc., personal communication, March 10. 2017.
The author
James Dietrich ([email protected]) is a consulting reservoir engineer for the Dietrich Corp. He holds a BA in geology and an MS in engineering science from U.C. Berkeley. He has presented more than 20 technical papers, 10 of which have been peer-reviewed and published by the Society of Petroleum Engineers.
