Horizontal unconventional wells optimized for EUR and ROI
Stephen Schubarth
Schubarth Inc. & SSS LLC
Houston
Stephen Holditch
Texas A&M
College Station, Tex.
Russell Chabaud
SSS LLC
Houston
Reservoir and completion characterizations can lead to significant improvements in well and development project economics. Focusing only on initial production (IP) values, however, could lead to poor project economics and a low return on investment (ROI). Understanding the nature of production decline behavior of very low permeability reservoirs completed with multiple transverse fractures is key to success.
Background
The US has become more energy independent with the development of unconventional reservoirs via horizontal wells and multistage fracture treatments. From an economic standpoint, however, these methods provided only marginal returns on the massive amount of capital invested. When the industry began completing these wells, laterals were 3,000-4,000 ft long and stage spacing was 200 ft or more. Securities analysts and investors desired production growth, and the industry responded by increasing lateral length, the number of perforation clusters, and treatment size while reducing stage spacing. This led to higher initial production values (IP) but at a substantial increase in capital cost. Initially, these higher IPs were thought to be an indication of increased estimates of ultimate recovery (EUR).
This article will demonstrate how changes in completion design affect IP, EUR, ROI and net present value (NPV). Some changes made to completion designs increased IP and EUR while others only increased IP.
Production rate acceleration has been an economic consideration since the early years of the petroleum industry. Understanding which completion design factors cause only initial production rate acceleration without a corresponding increase in EUR is the key to increasing ROI and NPV.
Performing reservoir numerical simulation using both finite difference simulation and analytical modeling enabled this understanding. Several technical papers using these methods found them to be a good indicator of well performance.2,3 One study concluded that fracture half-length had the largest impact on total recovery.4
A key assumption of this study was that only one or two effective producing fractures existed per stage.
Similar fracture simulation work has shown that, while many fractures may initiate during a treatment, no more than two fractures propagate a substantial distance.5 This article agrees with these conclusions based on the inability to describe the production history behavior with more than two fractures created per stage in the majority of studied cases.
Going forward, completion of these wells needs to focus on ROI-NPV rather than IP. The most beneficial economic course focusing on ROI-NPV is through reservoir and completion characterization by production history matching, followed by forward modeling using the information gained. The results obtained using this methodology run contrary to the path the industry has been taking, but a change of course may be necessary given economic performance obtained to date.
Methodology
Calculating the economic outcome of predicted producing rates over a 10-year well life and the well costs required to achieve those rates allows comparison of different completion and treatment designs. A 10% discount rate is used to calculate NPV, giving some advantage to early-time production rates. Costs in horizontal, multistage wells is heavily weighted to the completion side.
Many different costs go into overall completion expenses. Some are fixed (well site construction and production facilities for example), some are time-dependent (surface equipment rentals, well site supervision, working tank rentals, etc.) and some are volume-dependent (water usage and transportation, proppant usage and transportation, perforating guns, zonal isolation plugs, chemicals, etc.). Depending on how fracturing service providers have been contracted, their costs can be either time-dependent, stage-dependent, or a combination of both. A best minimal estimate of the incremental cost on a per stage basis was used in the economic evaluation.
Production decline behavior in wells generally follows the movement of created pressure transients through the reservoir by reducing pressure at the wellbore, resulting in hydrocarbon production. Rate of production and production totals over time create the revenue to pay for the investment made in the wellbore. Formation properties and the configuration of fractures to the wellbore create the shape of the production history.
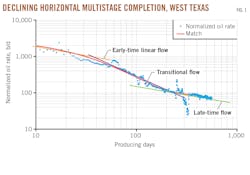
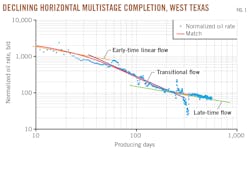
Production decline behavior in unconventional reservoirs completed with horizontal, multi-stage wellbores follows the same trends across the basins under investigation. Fig. 1 shows an example of this as a log-rate versus log-time plot for a well in Permian Basin. Initial production follows a one-half slope depicting early-time linear flow. As the pressure transients created in the reservoir meet between the fractures, the slope changes to near unity, which depicts transitional flow. The time to the end of the early-time linear flow depends primarily on the reservoir permeability and the distance between the fractures. Fluid properties and formation porosity also play a role, but these should be relatively consistent when comparing wells in the same field. Finally, production will trend back to linear flow as the area between the fractures depletes and production flows into the area created by the lateral length and effective fracture length. The level of production during this late-time, linear-flow period will be primarily a function of formation permeability and lateral length.
In planning for a single well completion, there are three primary design parameters that can be changed:
- Lateral length.
- Stage spacing (number of fractures created along the lateral).
- Treatment design (including proppant and fluid volumes, rate, and design of perforation clusters).
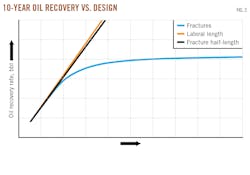
Fig. 2 shows the relationship between long-term production and each of these design factors. The graph indicates that long-term production (10-year cumulative in this case) has a linear relationship with increasing lateral length and increasing effective fracture half-length (Eff Lf). Increasing the number of fractures created along the lateral yields diminishing returns.
Forward production modeling forecasts from reservoir models requires characterization of reservoir properties and completion results from past wells. To obtain these data, rate transient analysis or production history matching is performed with the same simulators that were used in the forward model.
Production decline behavior has been similar across many unconventional basins in both oil and gas reservoirs. An early linear-flow period during which production flows into the created transverse fractures to the wellbore switches to a transitional-flow period when pressure transients created between the fractures meet and the area between the producing fractures is depleted. The production behavior then moves into a late-time linear-flow period, with fluid flowing linearly into the depleted area described by the lateral length and the transverse fractures. This all assumes that pressure transients moving out from the fractured area do not encounter transients from another well.
History-matching producing rates and flow periods determined average formation permeability, average effective fracture length, and the number of producing fractures along the lateral. Permeabilities determined through this methodology vary much less within a field than suggested by previous evaluations of the permeability range present in tight gas sands. Comparing actual average effective fracture lengths and the number of created fractures to the modelled treatment design reveals trends that can be used to forecast how these properties vary with treatment design.
Parametric study
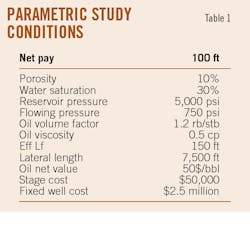
A simple parametric study determined the optimum number of stages for a reservoir of given parameters. Permeability was varied between cases to observe the change in optimum stages. Production was projected using an analytical solution for production versus time for horizontal wellbores with transverse hydraulic fractures in an infinite-acting reservoir for four reservoir permeabilities (1,000, 500, 250 and 100 nD). The number of created fractures varied from 10 to 100. Table 1 shows reservoir and production conditions. Producing time was limited to 10 years and the number of created effective fractures per stage was one.
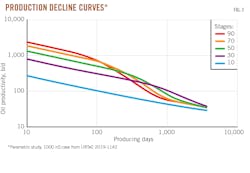
Fig. 3 shows the resulting production decline curves for each grouping of 10 created fractures along the lateral for the 1,000 nD case, indicating that as the number of created fractures increases, early-time production increases. However, as the spacing between fractures decreases, production declines more rapidly. Fig. 4 shows the 10-year cumulative production versus the number of created fractures along the lateral for all four permeability cases. As the number of created fractures increases, the incremental increase in 10-year cumulative production declines. Less incremental oil is recovered as fracture spacing decreases.
Fig. 5 illustrates the point at which the cost of creating an additional fracture becomes greater than the value added by that fracture for each of the reservoir permeability cases. The cost of creating a fracture is plotted over the data, and the point at which the value added is less than the cost of creating the fracture is the point at which there is no reason to spend the money needed to create that fracture. The graph indicates that the maximum number of profitable stages is about 48 for the 1,000 nD case and about 77 for the 100 nD case.
Field data analysis
Evaluation of six wells producing in Powder River basin from the Mowry formation and operated by EOG Resources Inc. demonstrated the process and results using actual producing wells. All technical data is from public sources or derived from public data. Economic data, such as costs and revenue interest, are estimated.
The first step involves history matching the production data of each well using a proprietary analytical model. Fig. 6 presents an example of these matches from the Bolt 1-35H well. The best-match average effective fracture half-length was 140 ft with 1,500-nD formation permeability. The match also indicated that only one effective fracture was created for each stage. Table 2 summarizes the results of all six well matches.
Results of the production-history match determined the relationship between treatment size and effective fracture half-length (Fig. 7). This trend was used to project the cost of a treatment stage with respect to created effective fracture half-length. Knowing cost’s relationship to effective half-length allows incremental economic analysis of any treatment size and number of stages for any of these wells or future wells of a given permeability and lateral length.
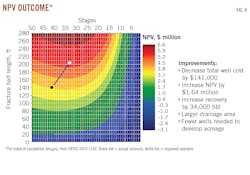
Performing predictive production evaluation for any number of stages pumped and any effective fracture half-length and evaluating the economics of every case allows generation of a matrix of predicted revenue from any completion scenario. Fig. 8 contains a map of NPV for Bolt 1-35H. A black dot shows the point where 41 stages were pumped with 140-ft effective fracture half-lengths. A white dot shows where a reduction in the number of stages (to 33) and an increase in effective fracture half-length (to 205 ft) resulted in improved well economics.
Fig. 8 also summarizes economics for both the actual and improved completion scenarios. The improved completion design decreased well cost by $141,000 (-2.5%), increased NPV by $1.64 million (+52%) and increased the 10-year oil recovery by 34,000 bbl of oil. The increased effective fracture half-length requires fewer wells to develop the reservoir.
Knowledge of reservoir permeability and created effective fracture half-length, gained by production evaluation, can yield cost savings and increased profit when developing a field. Knowledge of effective fracture half-length is especially useful in spacing wells to reduce interference.
Well spacing
Fracture hits occur when hydraulic fractures propagate into an adjacent wellbore. Propagated fractures extend further, sometimes much further, than their effective producing length. When fracture-treating a wellbore offset to an existing producing well, care should be taken not to encourage growth of the fracture towards the existing producer. Often, however, the fracture will grow and hit the nearby producing well. Not all hits are damaging to production in either well. It is only when the effective fracture half-lengths overlap that substantial damage, or reductions in ROI, occur.
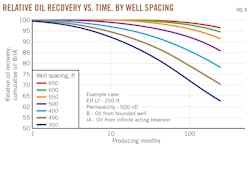
A 3D, finite-difference black oil simulator, built using a center well and offset on both sides with identical wells, demonstrated this scenario. Simulated production started from all three wells at the same time. The center well represented expected production from development wells for the reservoir. To compare recoveries, a single well in the reservoir was also simulated to represent production from a well in an infinite-acting reservoir. Simulations were re-run for each case varying the distance between wells from 350 to 700 ft. Effective fracture half-length was set at 250 ft and the spacing between producing fractures at 100 ft. Average formation permeability was 500 nD and lateral length was 10,000 ft. Production data versus time for each bounded case (B) were compiled and compared to recovery from the case using the infinite-acting (IA) single-well simulation case.
Fig. 9 shows how each bounded case compares with the IA case versus time. In early well life bound cases produced within 90% of the IA case. Later in well life these comparisons diverge dramatically due to the slow speed at which the pressure transient moves through the reservoir. Once the transients intersect, however, there is significant competition between wells, especially in cases where the effective fracture half-lengths overlap.
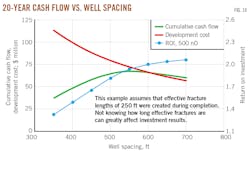
Going a step further and applying cost and potential revenue generated allows identification of the best well spacing to maximize cumulative cash flow and determines ROI for each case. It is assumed that each well cost $7.5 million and that the net revenue/bbl of oil produced, including all associated products, was $50/bbl. A parcel of land 1-mile wide was developed with the wells equally spaced.
Investment cost equals the number of wells required to complete the 1-mile wide section multiplied by well cost. Cumulative cash flow is oil recovered from each case over 20 years multiplied by $50/bbl with a nominal operating cost subtracted of $5,000/well/month. Fig. 10 shows cumulative cash flow, investment cost, and ROI for each case. Maximum cumulative cash flow value lays between 500 and 600 ft well spacing.
As well spacing falls below 500 ft, effective fracture half-lengths overlap and ROI declines dramatically. The knowledge gained from characterizing effective fracture half-lengths through production analysis, therefore, can have a tremendous impact on spacing wells and maximizing a development project’s ROI.
References
- Schubarth, S.A., Holditch, S., Chabaud, R., “Optimizing Unconventional Completion Designs: A New Engineering and Economics Based Approach,” URTeC: 2019-1142, Presented at the Unconventional Resources Technology Conference, Denver, Colo., July 22-24, 2019. DOI 10.15530/urtec-2019-1142
- Mayerhofer, M.J., Stegent, N.A., Barth, J.O., and Ryan, K.M., “Integrating Fracture Diagnostics and Engineering Data in the Marcellus Shale,” SPE Annual Technical Conference and Exhibition, Denver, Oct. 30-Nov. 2, 2011. doi.org/10.2118/145463-MS
- Li, N., Mayerhofer, M., Childers, A., Weitzel, B., White, R., Lolon, E., and Melcher, H. “Optimizing Well Placement and Completion Strategies in the Piceance Basin Niobrara Formation,” Unconventional Resources Technology Conference, San Antonio, Aug. 1-3 2016. doi:10.15530/URTEC-20162435473
- Li, N., Lolon, L., Mayerhofer, M., Cordts. Y., White, R., and Childers, A., “Optimizing Well Spacing and Well Performance in the Piceance Basin Niobrara Formation,” SPE-184848-MS, SPE Hydraulic Fracturing Technology Conference and Exhibition, The Woodlands, Tex., Jan. 24–26, 2017. doi.org/10.2118/184848-MS
- Wu, K., Olson, J., Balhoff, M. T., and Yu, W., “Numerical Analysis for Promoting Uniform Development of Simultaneous Multiple-Fracture Propagation in Horizontal Wells,” SPE 174869-MS, SPE Annual Technical Conference and Exhibition, Houston, Sept. 28-30, 2015. doi.org/10.2118/174869-MS
The authors
Steve Schubarth [[email protected]] is president at Schubarth Inc & Schubarth Software Systems LLC. He previously worked for operators, a service company, a proppant manufacturer, and as a consultant for SA Holditch & Associates. Schubarth holds BS and MS degrees in Petroleum Engineering from Texas A&M University. He has authored and co-authored about 30 technical papers and articles, with a primary focus on improving economics through hydraulic fracture treatment design and evaluation.
Stephen A. Holditch (deceased) most recently was professor and associate director of Texas A&M’s Crisman Institute for Petroleum Research. He was a faculty member at Texas A&M since 1976. Holditch received his BS(1969), MS (1970), and PhD (1975) all in petroleum engineering from Texas A&M University. He held various leadership positions in SPE, including vice president–finance, member of the board of directors (1998-2003), and president (2002). In 1995 he was elected to the National Academy of Engineering and in 1997 he was inducted into the Russian Academy of Natural Sciences. He was elected as an SPE and AIME Honorary Member in 2006.
Russell A. Chabaud works as an operator, owner and investor in the US oil and gas industry. His previous experience includes drilling, completing, and producing hundreds of fracture-stimulated wells in South Texas, southwest Wyoming, and the Four Corners area of Utah, New Mexico, Colorado, and Arizona. He began his career in 1971 with Amoco Production Co. and started in business on his own in 1981. Chabaud graduated from Louisiana State University with a BS in petroleum engineering (1971).
Based on “Optimizing Unconventional Completion Designs: A New Engineering and Economics Based Approach,”, URTeC: 2019-1142, Presented at the Unconventional Resources Technology Conference, Denver, Colo., July 22-24, 2019. DOI 10.15530/urtec-2019-11421
