Gas injection affects Marun field PVT properties
Mohammad Jamshidnezhad, National Iranian South Oil Co. Ahwaz, Iran
A study determined the changes in pressure-volume-temperature (PVT) properties caused by gas injection in the Marun field Asmari carbonate reservoir in Iran.
The study calibrated the equation-of-state models for compositional simulation and established a means for predicting fluid properties in all areas of the field.
The study was part of a broader effort to characterize reservoir fluids for compositional simulation. Laboratory PVT reports on 19 appraisal wells (15 wells before gas injection and 4 wells after gas injection) were the basis for the compositional simulation.
The study applied a Peng-Robinson equation of state (EOS)-based PVT program on the PVT data from samples collected before gas injection. A regression technique with dynamic parameter selection tuned the EOS to match these PVT data, after which the tuned Peng-Robinson EOS determined the PVT data from the wells sampled after gas injection.
Generated results compared well with laboratory data.
Iran oil production
Iran has about 90 billion bbl of proved oil reserves, or roughly 9% of the world’s total. The majority of Iran’s crude oil reserves are in giant onshore fields in the Khuzestan region near the Iraqi border and Persian Gulf terminus.
More than half of Iran’s 40 producing fields contain more than 1 billion bbl of oil. The onshore Ahwaz, Marun, Gachsaran, Agha Jari, and Bibi Hakimeh fields account for about two-thirds of Iran’s oil production.
Most or Iran’s crude oil is low in sulfur, with gravities in the 30°-39° API range.
Iran’s onshore field development work is concentrated mainly on sustaining output levels from large, aging fields. Consequently, enhanced oil recovery (EOR) programs, including gas injection, are under way in a number of fields, including Marun.1
Marun field
Marun field is in the central part of the Dezful embayment, a tectonically depressed area having the majority of Iran’s oil fields. Reservoirs include fractured and porous carbonates and sandstones of the Asmari formation of Oligocene and Miocene age and the carbonates of the Cretaceous Bangestan group.
The field is a layered fractured limestone and sandstone reservoir.
Exploration in the field started in 1963 with production starting in 1966. Production rose gradually and in 1972 exceeded 1 million b/d.
Later, due to difficulties production fell and in recent years is about 500,000 b/d.
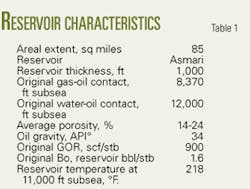
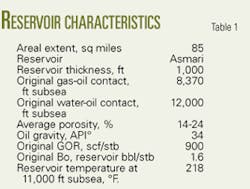
Table 1 summarizes the field’s characteristics.2
The dual Aghar-Dalan field development is a recent National Iranian Gas Co.’s (NIGC) gas utilization project. Since coming online in mid-1995, the Aghar and Dalan fields have produced about 600-800 MMcfd.
A gas processing plant at the Dalan field handles gas from both fields. Part of the gas is used for a 40-Mw power plant in the Dalan field, while most of the treated gas from the Dalan processing plant flows through a 212-mile pipeline for re-injection in the Marun field.1
Laboratory PVT data
The Asmari reservoir has 19 bottomhole fluid samples, collected as follows: 3 before production started, 12 after production and before gas injection, and 4 after gas injection started.
Information on the PVT reports generally includes:
• API gravity, density, and molecular weigh to C7+.
• Bubblepoint pressure at different temperatures.
• Constant composition expansion (CCE) data.
• Differential liberation data.
EOS tuning
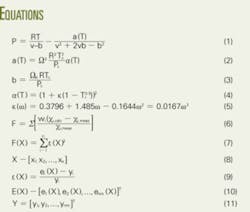
In this study, a three-parameter Peng-Robinson (PR) equation of state, Equations 1-5 (see equation box) was matched to all 15 laboratory PVT data sampled before gas injection in the Asmari reservoir of Marun field.3
A regression technique with dynamic parameter selection tuned the equation of state.4 The regression included minimizing the objective function (Equation 6).
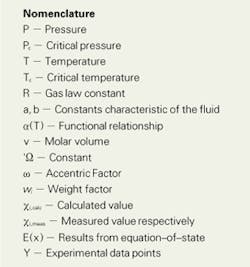
In Equation 6, wi is the weight factor and xi,calc and xi,meas correspond to the calculated value and measured value respectively.
The objective function of the regression involves the solution of complex nonlinear equations such as flash and saturation-pressure calculations.
The dynamic selection of the most meaningful regression parameters from a larger set of variables is useful in EOS fitting because it alleviates the difficult problem of deciding the best regression variables.
Implementation of the dynamic-parameter-selection strategy for tuning the EOS requires the solution of a nonlinear optimization problem. In terms of least-squares, the optimization problem may be stated as Equation 7, in which Equation 8 defines X.
X is the regression-parameter vector, with nr being the number of regression parameters and nm the number of measurements to be fitted.
Equation 9 is for the equation of state adjusted to match a set of experimental data Y with Equations 10 and 11. In these equations E(x) is the equation-of-state results and Y the experimental data points. In this case the nonlinear least-squares problem consists of adjusting X so that the EOS results match the experimental measurements.
A robust minimization method is therefore required for rapid convergence to the minimum. This study used a modification of the adaptive least-squares algorithm.5 6
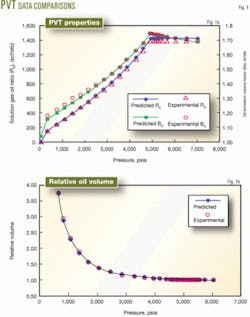
Fig. 1a and 1b compare the laboratory PVT data and generated PVT data with the tuned EOS.
null
Changes in PVT properties
After gas injection, NISOC sampled from four wells and conducted PVT experiments on them.
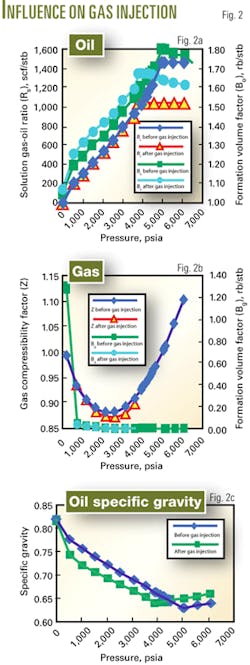
Figs. 2a, 2b, and 2c show the difference in PVT data before and after gas injection.
For a well below the saturation pressure, the oil formation volume factor, Bo, after gas injection started is greater than the Bo before gas injection. Above the saturation pressure the Bo after gas injection is less than the Bo before gas injection.
Changes of oil specific gravity, o, due to gas injection are inverse of changes of Bo. Solution gas ratio, Rs, below saturation pressure remains unchanged but above the saturation pressure, the Rs after gas injection is less than the Rs before gas injection.
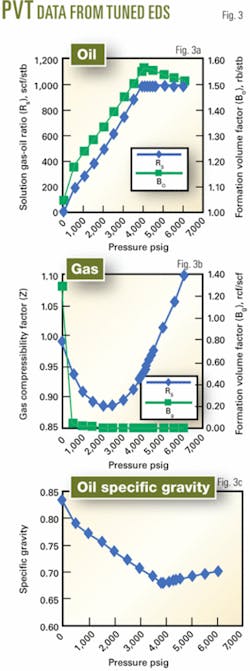
The tuned equation of state from the wells before gas injection predicted the PVT properties for the wells after gas injection (Figs. 3a, 3b, and 3c).
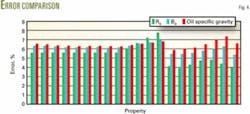
Fig. 4 compares the laboratory PVT data and the generated results with the tuned EOS for a well after gas injection. The results showed an average error of less than 6% and maximum error of about 7.79%.
References
1. US Department of Energy, Country Analysis Brief on Iran, (www.eia.doe.gov/cabs/Iran/).
2. Saidi, A.M., Reservoir Engineering of Fractured Reservoirs, Total Edition Press, Paris, 1987.
3. Peng, D.Y., and Robinson, D.B., “A New Two-Constant Equation of State,” Ind. Eng. Chem. Fundam, Vol. 15, 1976, pp. 59-64.
4. CMG software user’s guide, Version 2004, Computer Modeling Group Ltd., 2004.
5. Dennis J.E. Jr., Gay, D.M., and Welsch, R.E., “An Adaptive Nonlinear Least-Squares Algorithm,” ACM Trans. Math. Software, Vol. 7, No. 3, September 1981.
6. Chen, H.S., and Stadtherr, M.A., “A Modification of Powell’s Dogleg Method for Solving Systems of Nonlinear Equations,” Comp. and Chem. Eng., Vol. 5, No. 3, 1981.
The author
Mohammad Jamshidnezhad ([email protected]) is a scientist at the National Iranian South Oil Co. in Ahwaz, Iran. Previously, he was a part-time assistant professor at Chamran University of Ahwaz. Jamshidnezhad has a BS from Abadan Institute of Technology, Abadan, Iran, and an MSc and PhD from the faculty of engineering, University of Tehran.
