Benchmarking study compares LNG plant costs
A benchmarking study of several recent LNG projects at greenfield locations compared specific costs and show that low specific cost and low emissions are not mutually exclusive. It further showed that a design with better environmental performance does not necessarily entail higher unit costs.
Merlin Associates, Houston, conducted the study, which was commissioned by Shell Global Solutions International BV.
null
The analysis emphasized actual implementation figures from projects that have become operational.
The study used consistent as-built data for reliable benchmarking analysis.
The greenfield projects in this benchmarking analysis included:
- Oman LNG LLC, Qalhat. Initial two-train installation (Fig. 1).
- Nigeria LNG Ltd., Bonny Island. Initial two-train installation.
- Qatar Liquefied Gas Co. Ltd. (Qatargas), Ras Laffan. Initial two-train installation.
- Ras Laffan LNG Co. Ltd. (Rasgas), Ras Laffan. Initial two-train installation.
- Atlantic LNG Co. of Trinidad and Tobago. Initial one-train installation.
The Oman LNG and Nigeria LNG plants use Royal Dutch/Shell Group's LNG technology.
The study adjusted the project scopes to account for major differences in design bases; this helped focus the analysis on technical and technology-related costs. It also translated all costs to an assumed Middle East (Qatar) location.
In addition, the study compared environmental performance in terms of CO2 emissions. CO2 emissions are a measure of LNG process efficiency and overall plant fuel efficiency.
Cost sources, estimating methodology
Capital expenditure data originated from:
- Merlin Associates' large database of actual LNG project costs. This resulted from previous consulting services to existing LNG project participants, financial institutions providing project financing, and our internal development of LNG process design and cost-estimating software.
- Merlin's proprietary LNG capital-cost estimating model. The model includes actual equipment lists for all database projects. When the model calculates a new LNG capital cost estimate, it selects equipment and other specifics appropriate for the specified LNG project; costs are adjusted to reflect the proper sizing. The model includes data for each LNG liquefaction technology.
- Shell Global Solutions for projects in which it participated but where Merlin Associates was not involved with the support of project finance (limited data).
A major variable in LNG project capital-cost estimates is the construction labor rate and associated work productivity.
Our database of actual project costs and man-hours expended was the primary source for these data.
To prepare LNG cost estimates quickly and efficiently, Merlin Associates compiled a generic labor organizational staff requirement for an LNG project.
We compiled actual project data to produce an average productivity adjusted, all-in labor rate for that project. This is the average rate paid to all subcontractors for a project by the engineering, procurement, and construction contractor. It includes hourly average wages, supervision, overheads, profits, and all other subcontractor indirect costs.
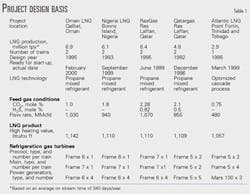
Table 1 shows the individual project design basis.
Capital cost adjustments
Appropriate adjustments limited the benchmarking to technology-related items. They included:
- Adjustments to LNG projects to account for dissimilarities in processing configuration resulting from different feed-gas compositions.
- Cost adjustments for acid-gas removal units, which capped the CO2 in feed gas at 1.0 mole %.
- Inclusion of on-site fractionation (at a minimum, refrigerant make-up production) to normalize the differences in fractionation systems.
- Adjustments to the same size, technology, and site requirements for LNG storage, loading, and marine systems costs. We set LNG product storage at 2 x 100,000 cu m, pumpable. The Oman LNG scope defined the LNG loading and marine facilities.
These adjustments normalized all project costs so that any remaining variances resulted mainly from differences in process technology and technical design of utility and support systems.
- Residential areas, hospitals, and other local infrastructure such as gas transmission pipelines.
- LPG export-import facilities.
- Construction camps.
- Sulfur removal and recovery facilities, which had an impact on Qatargas and Rasgas.
- Marine facility dredging.
- Owner costs and pre and post-operational costs.
Specific exclusions included:
Our capital-cost estimating model calculated total project costs based on the leveled project basis.
Where appropriate, we adjusted the model cost estimates using available, as-built cost data.
The assumed, normalized project location for the analysis was based on a Qatar location with Indian labor. The average, all-in labor rate for this location is $14.50/hr, with an average labor productivity of 0.38 (US Gulf of Mexico = 1.0).
Engineering, procurement, and construction indirect costs are included separately in the total project capital-cost estimate.
Existing project capital costs were escalated to constant Jan. 1, 2000, US dollars using Nelson-Farrar cost index data (OGJ, Mar. 3, 2003, p. 50).
Capital costs
Fig. 2 shows the specific cost for each project in $/tonnes/year ($/tpy) of LNG capacity. Annual LNG capacity reflects an average on-stream time of 340 days/year.
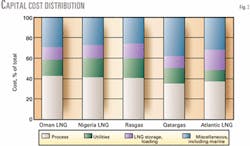
Fig. 3 shows the adjusted distribution of capital costs for the designated projects broken down into major cost categories.
CO2 emissions
Total CO2 emissions reflect the type and number of gas turbines used for refrigerant compression, power generation, and other major process requirements for heat.
The calculation also reflects expected CO2 emissions from feed-gas purification, boil-off gas recovery (if applicable), and major, continuous process flaring (if known).
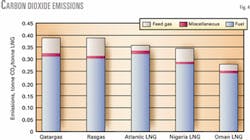
Fig. 4 compares tonnes of CO2 emissions/tpy of LNG capacity.
It shows the distribution of CO2 emissions for the total gas turbine combustion (both compressor drivers and electric generators), miscellaneous process and utilities, and incoming feed gas.
The data show the difference between total CO2 emissions and emissions from energy consumption (fuel, flaring, etc.).
The latter method represents a better view of the plant design's efficiency and the operator's drive for minimizing emissions.
Overall efficiency is a function of the process design (heat and cold integration for optimized usage), the main compressor drivers and power generator equipment types, and the extent to which venting and flaring are minimized and waste heat is recovered.
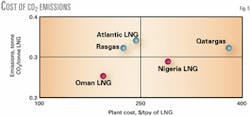
Fig. 5 shows the relationship between unit plant capital expenditure and CO2 emissions from fuel (gas turbines and miscellaneous emissions only).
The results clearly show that a design with better environmental performance does not necessarily entail a more expensive design; it is possible to combine a low-cost design with low CO2 emissions.
Conclusions
The benchmarking data show that the Oman LNG base project is the best in class of all the recently implemented two-train LNG plants in terms of specific costs; its environmental performance compares favorably with that of other projects.
In the benchmarking study, we developed a method that compares environmental performance of different project designs in terms of CO2 emissions. This gives a total view of overall design efficiency.
In addition to process thermal efficiency, the chosen drivers and power generators, and venting and flaring philosophies are also important contributors to overall plant environmental performance.
Low unit cost and low CO2 emissions are an achievable combination. Companies do not need to choose one at the expense of the other.
Acknowledgment
The authors thank Eva Heyman and Rachel Crocker of Shell Global Solutions International for their assistance in providing supplementary information for projects in which Shell was closely involved with project design and implementation.
The authors
Chuck Yost is president and co-founder of Merlin Associates, Houston. He has many years of experience in cryogenics, natural gas production and processing, LNG and alternative fuel industries, and nitrogen-based fertilizer production. His experience includes positions in operations, maintenance, and management, and work at engineering design firms. Yost holds a BS in chemical engineering from Iowa State University and an MBA (honors) from the University of Wyoming.
Robert DiNapoli is vice-president and co-founder of Merlin Associates. He has many years of experience in cryogenics, industrial gas, LNG and alternative fuel industries. His experience includes positions at several engineering design firms and industrial gas production companies. He has a BS (honors) in chemical engineering from Tufts University, Medford, Mass.


