Data mining algorithm selection: decision trees
The visual data mining process, seen in the first part of this two-part article, revealed patterns in four dimensions between cumulative gas well production and independent variables. "Jump discontinuities" in visual plots led to use of data mining decision trees as an ideal form of analysis useful in obtaining a profit exploration pattern from the British Columbia database.
Four years of research led to a specific decision tree data mining algorithm yielding best results. Results obtained from the BC database were excellent, revealing $4.7 billion (US) in high cumulative gas production potential wellsite targets. The results indicate entering certain formations with the same characteristics as the data mined "high grade" targets will achieve similar profitability levels in terms of high cumulative gas production.
Decision trees start with broad characteristics and progressively narrow the focus onto specific independent variables that relate to the target, for example, high cumulative production gas wells.
Data miners take a "leave no stone unturned" approach: Algorithms will consider all potential variables against the target of finding a high cumulative production oil or gas well. Some judgment by analysts near the end of the data mining process may be needed where certain independent variables are more convenient as exploration variables in actual exploration programs. The most important judgment by the analyst is what criteria will be set for sensible economics for exploration.
In this case, criteria chosen for economic potential for gas well returns was the 85th percentile of cumulative gas production in the BC database. This 85th percentile value was chosen as go/no go criteria for an exploration target.
The 85th percentile is equivalent to 96,062,000 cu m or higher in cumulative gas production (3.39 bcf). Other target criteria could be developed which better account for production life of a well, such as measures that account for well life span, i.e., cumulative production divided by life of well.
Decision tree data mining techniques perform four important functions. Decision trees:
1. Operate as a form of exploration tool on geological field data collected and stored in a database;
2. Have the ability to define risk adjusted profit;
3. Have an ability to identify potential chance(s) of success on new targets within exploration areas where geology is known; and
4. Produce a set of clear criteria easy to understand by exploration staff.
From an investment perspective, these four functions of decision trees promote a viewpoint that gas and oil fields can operate as a form of a resource annuity pool. In other words, data mining decision trees will produce a nonbiased risk and reward outlook for developing certain properties while establishing roughly how much income is probable from a given group of properties in terms of cumulative gas or oil production.
Project investors, such as banks or private and public investors, may tend to understand this approach in that it is a similar approach taken to valuing bonds for mortgage companies. Mortgage company bond appraisals are tied to an assessment of potential returns produced by any given property. Oil properties using decision trees could take a similar approach, allowing better planning of investment commitment by management and investors while at the same time meeting economically oriented exploration needs of oil and gas companies.
When trained on several geological environments, decision tree algorithms when supplied new data, can detect high likelihood hits on new oil and gas exploration targets.
One Danish oil and gas company, DONG A/S, with $1.64 billion (US)1 in revenue in 2001, is already enjoying first mover competitive advantage using a data mining annuity approach.2
The Asset Management Group under DONG A/S's Exploration and Production A/S unit collects, structures, and evaluates data for business operations using a Monte Carlo data mining technique. This technique tracks nearly 40 assets in Denmark, Norway, and Greenland, and factors in fluctuating market oil prices.
DONG A/S's data mining application allows users to estimate chances of discovery based on geological risk analysis, calculation of distributions of hydrocarbons in place, recoverable reserves, field and well productivity, and required number of wells using the probabilistic Monte Carlo simulation data mining technique.
Data Forest Mining's technique is somewhat similar. Hundreds of exploration data mining "hits" achieved levels of 63% odds of finding gas wells producing 96,062,000 cu m of cumulative gas production and above, with one set of 23 gas wells achieving 94% odds of finding gas wells producing at this same level on test set data.
The criteria produced by decision trees can be tied into a geographical information system (GIS). Using the criteria produced by the decision tree, one can then eliminate formations with low to no possibility of producing gas, based on the decision tree. Exploration programs can then be tasked towards high potential return areas.
Other data mining approaches have been applied in oil and gas. The Nebraska Oil & Gas Commission published a description of a neural net technique applied to establish relationships between 140 waterflood unitization regulatory hearings and the subsequent secondary-to-primary recovery ratio for a field in the Nebraska panhandle.
With funding provided by the US Department of Energy, Coral Production Co. was able to complete its study through a subcontract with Correlation Co.3 The resulting correlation predicted that the Cliff Farms Unit would produce 103,000 bbl of secondary oil while the neural network obtained an 85% trained correlation coefficient that was based on four parameters and primary recovery from any group of wells the data mining tool could predict.
Secondary recovery was predicted with 85% certainty.4 No train and test comparison numbers were provided in the internet release of this report for quality control review.
Data mining setup
A training set is a set of data in which the decision tree trains itself to detect a pattern using several nonlinear statistical tests, much as a child will learn by experience. The word "preclassified" means the target field, or dependent variable we wish to predict, has a "known" class. The "known class" in this database is gas and oil production figures for all gas wells in BC.
After training decision trees against data, the algorithm is then run against new data in a test set. Before algorithm training, a test set is randomly extracted from the original set. This step provides a quality control check with later comparisons shown between the trained algorithm and the test set which will demonstrate whether the algorithm works. A well-trained algorithm should successfully classify new data (test set or new field data) with results matching results from the training set.
Data Forest Mining used SQL database language to clean and shift 0.6 million rows of geological gas and oil into a form acceptable for decision tree input, i.e., cumulative gas production with associated variables. SQL work included combining several database tables into one overall BC geological database.
Results from SQL work generated 6,313 distinct wells in BC over the past 30 years with cumulative gas well values below, equal to, and above the target value.We examined 15 independent variables, both categorical and scale. The examination covered 94,695 data records matched against a cumulative gas production variable.
The target dependent variable for the algorithm was a binary value: "yes," greater than or equal to 96,062,000 cu m of cumulative gas produced. "No" is less than 96,062,000 cu m cumulative gas production. The binary is Equation 2. SQL is used to insert this binary "yes" and "no" as a new field: IF (A2> = 96,062,000, "1," 0) (2)
Binary "1's" indicated greater than 96,062,000 cu m in cumulative natural gas production. An oil target value was ignored in this instance as decision trees only target one value at a time, but oil still adds value and calculations can be added to determine co-production with gas.
A decision tree starts with general characteristics common to a profitable exploration target, i.e., similar formations in several different areas. The algorithm, through a series of nonlinear statistical tests, then homes in on more direct factors and relationships leading to high cumulative gas well finds.
Decision trees are not difficult to understand. Anyone who has played the game "Twenty Questions" will have no difficulty understanding the way a decision tree classifies geological records.
In this game, one-player thinks of a particular place or thing that would be known or recognized by the participants, but that the player gives no clue to its identity. The other players try to discover what it is by asking a series of yes-or-no questions. A good player rarely needs the full allotment of 20 questions to move all the way from "Is this a car?" to "Is this 'The Sound of Music?'"
A probability approach is then applied to various decision tree criteria or branches. For example, if 90 wells were predicted to be high production gas producers at an end leaf node on a tree using a certain criteria (historically, there were 110 high production gas wells) then there is a 90/110, or 81.8% probability of having a high production gas well using the same criteria.7
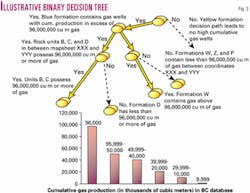
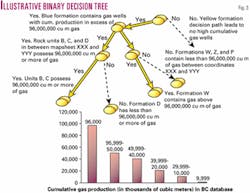
Geological database records enter the tree at the root node located at the top of the tree in Fig. 3. There are different algorithms for choosing the initial test and subsequent tests, but the goal is always the same: to select the test that best discriminates among target classes. In this case, target class is either "yes," greater than 96,062,000 cu m cumulative production, or "no," less than 96,062,000 cu m cumulative gas production.
At leaf nodes in a decision tree, records cannot be subdivided further. In a statistical sense, there are not enough records for further subdivision when tested or when one independent variable class predominates. This brings us to decision tree rules.
Decision tree rules might say that one has a 63% likelihood of finding 96,062,000 cu m of cumulative gas production on average if one drills to the "Blue formation." For example, certain units produce high cumulative gas production wells such as in areas B, C, and W, between map coordinates X and Y, within the Blue formation (Fig. 3).
If the decision tree's set of rules for finding potential high production gas wells is sound, as in, within 5% difference between test dataset and training results, then one can be very confident that the tree has produced valid rules that can locate high production gas wells in the field. Later in this article we present the actual "quality control" graph of this train-test comparison.
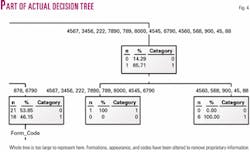
Fig. 4 displays part of a final decision tree (on the training dataset) produced in this work. Note 100% accuracy of classification in Fig. 4 for the training set was 94% accurate in the test set. As relatively few gas wells (23 gas wells) were found at 94% odds, this small amount of data points creates some variation between the training and test set. More data would likely eliminate this variation.
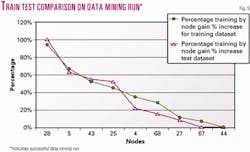
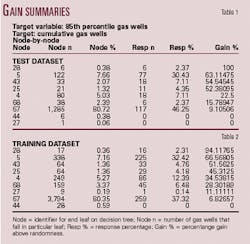
Each node will deliver a probability of success for discovering these wells as seen on the Y-axis of the graph in Fig. 5. A gain chart approach is typical of determining effectiveness of data mining; if two lines nearly overlap (Fig. 5), this indicates the algorithm has been successfully trained on the training data set to pick out actual relationships in new data as represented by test data. One then calculates a risk adjusted profit return for each node using data from Tables 1 and 2. These calculations will show expected profit for each end node in the decision tree.
From the tables, we can now calculate potential profit. Assume a wellhead value of 2001 of $4.25(US)/Mcf for natural gas.We determine potential revenue using the above gain charts, realizing that potential profit is revenue per node minus average cost per node adjusted for risk. We adjust for risk by using the following steps to obtain potential profit figures:
1. Chance adjusted revenue = gain % (chance of success). $14,417,659 (or 96,062,000 cu m times conversion of "1 m3 = 35.3147 cu ft of gas" times $4.25(US)/Mcf) 94% gain . $14,417,659 = $13,552,599 risk adjusted revenue
2. Risk adjusted cost (adjusted for chance of nonsuccess) = ($331,961 minus (100
3. Profit per node = risk adjusted revenue minus risk adjusted cost = $13,552,599
We expect between 94% and 100% chance of "finding" gas wells with greater than or equal to 96,062,000 cu m of cumulative gas production for 23 well targets within certain formations, areas, and other geological factors. Below this level of 94% chance of success, we identified 460 potential well targets at 63.1% to 66.6% chance of finding greater than equal to 96,062,000 cu m cumulative production.
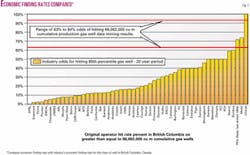
Industry achieves a median value of 14.93% industrywide as a rate for obtaining 96,062,000 cu m cumulative gas production wells in BC. We continue down the tables until we reach noneconomic extraction of gas according to the gain calculation procedure above. These figures represent an economic probability of return rather than a "finding" probability for gas (finding rates are often quoted by geophysicists), so that the graph below should be an accurate comparison.
As revealed in Fig. 6, this data mining method exceeds the industry median value of 14.93% chance of finding this class of well. Data mining reveals $4.7 billion (US) in potential profit from the BC database. By linking this method with GIS systems, this should enable exploration geologists to focus more on key areas with geological formations that decision tree criteria indicate as having highest probability of high production gas wells.
It is Data Forest Mining's belief that data mining will be in common use by the energy sector in the years to come. This technique holds as much promise as geophysics techniques do today. Data mining has potential in advancing field exploration and risk management by saving on cost and maximizing profit.
References
1. Based on FOREX exchange conversion of 0.12 Danish krones = $1 (US) in 2001.
2. Various authors, AVS Advanced Visual Systems (www.avs.com/solutions/oil_gas/dong.html).
3. Nebraska Oil & Gas Commission (http://ogm.utah.gov/oilgas/DOWNLOAD/downpage.htm)
4. Nebraska Oil & Gas Commission.
5. Nebraska Oil & Gas Commission, p. 254.
6. Tsur, Shalom, and Shen, Wei-Min, "An Overview of Database Mining Techniques," Argonne National Laboratory, Nov. 14, 1996, p. 12.
7. Berry, Michael, and Linoff, Gordon, "Data Mining Techniques: For Marketing, Sales, and Customer Support," John Wiley & Sons, 1997, p. 253.
8. Heckerman, David, "A Tutorial on Learning with Baynesian Networks," Microsoft Research Advanced Technology Division,Technical Report MSR-TR-06, March 1995, p. 7.
9. Hong, June Se, and Weiss, Sholom, "Advances in Predictive Models for Data Mining," Pattern Recognition Letters Journal,Vol. 22, No. 1, January 2001, p. 10.
10. Petroleum Services Association of Canada, Calgary, annual survey project cost figures for 2001. Figures include cost of well, infrastructure cost, and building of location. Cost figures exclude environmental, geophysical-geological costs, well servicing, and downstream facilities.
