2003: Processing outside North America nearly grabs the lead
With 2003 natural gas production outside the US and Canada growing and North American production (excluding Mexico) falling, it is little wonder that gas processing activity last year made healthy advances almost everywhere but in the US and Canada, where activity continued to shrink.
Worldwide natural gas production in 2003 (OGJ, Mar. 8, 2004, p. 74) increased by more than 5% over 2002 (OGJ, Mar. 10, 2003, p. 70), despite flat production gains in the US (+1%) and drops in Canada (2.3%).
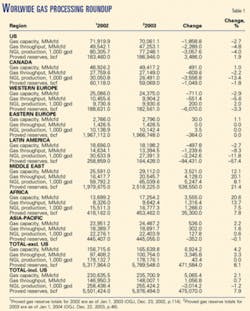
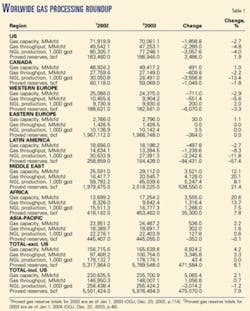
Similarly, worldwide gas processing capacity in 2003 increased by more than 2% and, removing the US from the calculation, by more than 4%, according to the latest Oil & Gas Journal data that also reflect corrections based on new information (Table 1).
Processing capacity in North America—US, Canada, and Mexico—which historically leads the world, increased in 2003 by only about 1% and actually dropped by nearly 1.5%, if only the US and Canada are considered.
Predictions in the 2003 Gas Processing Report (OGJ, June 30, 2003, p. 52) of increased natural gas production in response to improving world economies have been borne out. Historically high natural gas prices in Europe and North America have prompted higher worldwide natural gas production wherever possible—which mostly excludes the US, despite predictions for impressive demand growth there out to 2025.
In the US, many prospective natural gas exploration areas are untouchable, reviving plans for expensive, long-distance natural gas pipelines from Arctic fields and increased natural gas imports from Canada.
The market has also prompted plans for greater LNG shipments from new or rapidly expanding liquefaction centers in, among other places, Trinidad and Tobago, Algeria, Qatar, and the Russian Far East, mainly on Sakhalin Island (OGJ, June 14, 2004, p. xx).
The US last year experienced a blizzard of more than 30 proposals for new LNG regasification terminals. As 2004 began, all four existing terminals were back in operation (two from mothball status) and each had already expanded, was expanding, or had active plans to expand.
There is every reason to believe that this trend—growing gas processing capacity outside North America while especially US activity stagnates—will continue. Much of the world's natural gas reserves lie in regions far removed from their major markets and will need processing and, in some instances, liquefaction and regasification—processes that themselves can produce marketable liquids.
On the verge
For some time, OGJ has been watching and reporting on the diminishing dominance of North American, especially US gas processing among the world's regions. Clearly the most important cause has been reduced natural gas production in the US and Canada that has not been offset by strong production growth in Mexico, as if it could be. It seems clear that when we revisit this trend next year for 2004, the US and Canada will have lost their historical dominance.
For 2003, the balance in gas processing capacity nearly tipped to regions outside North America as US and Canadian capacity slipped to fractionally more than 50% of the world's overall capacity from 52% for 2002. In addition, production of NGL in the US and Canada fell in 2003, by more than 16%. The two countries combined in 2003 to produce slightly more than 40% of the world's production of NGL, off from 42% in 2002.
Pulling Mexico from the Latin America column and adding its figures to those for Canada and the US reveal that North America holds:
More than 52% of the world's processing capacity, down from more than 54% in 2002 and 55% for 2001.
As much as 46% of its NGL production, down from 48% in 2002 and nearly 52% for 2001.
Whether the growth of Mexican capacity tenuously retains North American dominance will depend on the success of Pemex's current and ongoing campaign to increase Mexican natural gas production.
Dan Lippe, president of Petral Consulting Inc., Houston, watches US gas processing, especially along the Gulf Coast. He told OGJ that gross profit margins for gas plants operating under "frac spread" or "gas price index" contracts in 2003 were "negative for 3 months in South Louisiana and South Texas, for 4 months for plants in the Texas Gulf Coast, and for 2 months for plants in West Texas." For plants in Wyoming, he said, gross profit margins were below breakeven for 5 months "but remained positive."
Lippe also said that ethane-recovery margins "(spot ethane price minus frac fees and raw mix pipeline tariff fees) were negative in all production regions except New Mexico for at least 3 months during 2003. In Oklahoma and the Texas Gulf Coast, ethane-recovery margins were negative for 9 months during 2003."
Some gas plants in these regions, he said, operate with percentage-of proceeds contracts, "with keep-whole provisions for ethane. These plants had to be in ethane rejection for most of 2003."
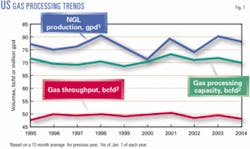
On Jan. 1, 2004, OGJ data show that US gas processing capacity stood at slightly more than 70 bcfd; throughput in 2003 averaged more than 47.2 bcfd; and NGL production, more than 77 million gpd (more than 1.9 million b/d; Fig. 1).
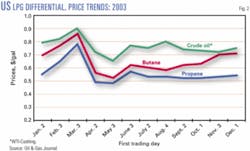
Fig. 2 shows pricing differentials in the US between LPG—the most widely traded NGL on the world market—and crude oil for the first trading day of each month in 2003.
The chart shows the historically normal relationship between LPG and crude oil that prevailed in late 2002 continued throughout 2003. The spikes in March and April reflect nervous energy markets upon the invasion and occupation of Iraq by armies of the US and UK, yet the market values moved generally in harmony.
Sources; the world
All gas processing activity figures in the breakout tables are based on Oil & Gas Journal's exclusive, plant-by-plant, worldwide gas processing survey and its international survey of petroleum-derived sulfur recovery.
Canadian data are based on information from Alberta's Energy and Utilities Board that reflect actual figures for gas that moved through the province's plants and are reported monthly to the AEUB. For 2000 for the first time, OGJ took these data for all of Alberta and compiled annual figures and thereby created a new baseline for data comparisons thenceforth.
In addition to AEUB figures for Alberta and to operator responses to its annual survey, OGJ has supplemented its Canadian data with information from the British Columbia Ministry of Employment & Investment's Engineering and Operations Branch and the Saskatchewan Ministry of Energy & Mines.
Data for Saudi Arabia derive from published reports in Saudi Arabia and reflect the most current and accurate information yet published in OGJ. They show the kingdom's presence in gas processing is even larger than previously published: More than 10 bcfd in capacity rank it fourth behind the US, Canada, and the UK; in 2004 its throughput was third; and in NGL production, only the US produced more.
This profile reflects the results of years of planning and construction as the kingdom begins to focus on its own and the region's petrochemical industry and to supply that industry with domestically produced feedstocks.
Last year, Saudi Aramco commissioned the 1.6-bcfd Haradh plant, a twin of the Hawiyah gas plant commissioned in 2002 and the first to process nonassociated gas.
New data also corrected information for Argentina and Bolivia to provide a clearer picture of gas processing in Latin America.
Outside Canada and the US as 2004 began, gas processing capacity stood at slightly more than 116 bcfd, an increase of nearly 6 bcfd compared with a year earlier; throughput for 2003 averaged more than 73.5 bcfd, ahead of 69.6 bcfd for 2002; and NGL production last year averaged more than 151.6 million gpd, up from more than 148 million gpd for 2002.
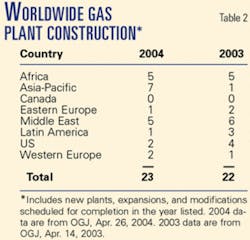
Table 2 provides a snapshot of the current state of gas plant construction in the world.
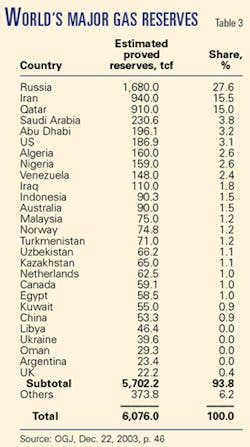
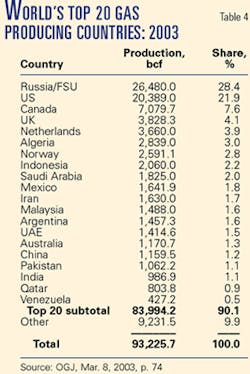
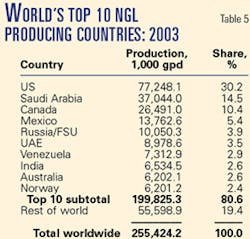
Table 3 ranks the world's major natural gas reserves by country at the start of 2004; Table 4, the world's top natural gas producing countries for 2003; and Table 5, the world's leading NGL producers.
Energy growth
The importance of natural gas in supplying the world's growing energy needs was borne out in the spring 2004 forecast for energy consumption from the US Energy Information Administration. World "marketed energy consumption," said the analysis, would increase by 54% over 2001-25, with the fastest growth occurring in Asia, especially China and India.
The fastest growing source of primary energy, said EIA, is natural gas, the consumption of which to 2025 will increase by 67% to 151 tcf. The report notes, however, that the current forecast for demand growth is lower that the forecast in 2003 because of, among other factors, "concerns about the long-term ability of natural gas producers to bring sufficient resources to market at prices competitive with those of other fuels."
Where there is increased natural gas production of whatever magnitude, there must also be increased natural gas processing.
Thus, among the areas of the world that OGJ's survey shows impressive processing-capacity growth are the Middle East and Africa.
In the Middle East, among the four nations from the region—Saudi Arabia, Iran, the UAE, and Qatar—that are members of OGJ's Top 20 natural gas producers (Table 4), natural gas production in 2003 was up by nearly 10% over 2002.
Last year, OGJ figures show, Saudi Arabia alone increased natural gas production by nearly 22%.
Sulfur production
In petroleum-derived sulfur recovery, worldwide production from refining and natural gas processing hit nearly 83 million tonnes/day in 2003 from almost 173 million tonnes/day in capacity. Both are increases from 2002.
Canada and the US continued to dominate the world in 2003, holding nearly 46% of processing capacity and slightly more than 47% of actual production; both shares represent declines from 2002.
Canada produced about nearly 21.4 million tonnes/day, a slight decrease over its 2002 production. The US produced slightly more than 17.7 million tonnes/day, also a decline.
Canada accounted for more than 22% of the overall total capacity; the US, more than 23.5%.
