Remote digital temperature monitoring aids hydrotests
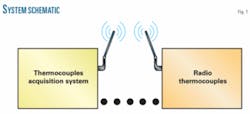
A new system allows real-time remote temperature monitoring along the length of a pipeline during hydrotesting. The system (Fig. 1) uses a radio temperature transmitter connected with a thermocouple installed underground on the surface of the pipeline, communicating the pipe’s temperature directly to a remote database that saves all data transmitted.
As new pipelines are built and proper facility maintenance requires increasing scrutiny of the integrity of pipelines long in service, the need for hydrotesting will only grow, placing an increasing premium on performing hydrotests as efficiently as possible. Unexpectedly large internal corrosion, external damage, or any other factor potentially reducing WT would also likely require hydrotesting in the current environment.
This article illustrates both the economic and data-quality aspects of remote digital temperature gathering during hydrotesting.
Background
Digital data and computing technology already address a wide range of issues in pipeline construction and inspection. These include mapping of the pipeline route, tracking material inventory, monitoring pipelay progress, organization of quality control data (including weld inspection), and generation of periodic project-monitoring and management reports. Removing test personnel from near the pipeline being tested will also reduce the possibility of accidental injury should the pipeline fail.
The immediate technological, data-quality, and economic effects of monitoring hydrotest parameters in the same manner manifest themselves in a number of ways. The pipeline operator no longer needs to rely on field representatives who may or may not have the authority to accept the measurements as accurate. Direct transmission of digital data to a centralized control center also lessens the possibility of errors during transcription.
Acoustic emissions testing performed on new pipelines during hydrotest, using acoustic sensors placed at 100-yard intervals on the pipe, can detect welding defects, leakage, and corrosion, but lacks a temperature component.
Remote digital monitoring and transmission of hydrotest data is already used in offshore applications but requires either literally tethering the vessel to the pipeline undergoing testing by long hoses and cables or two-way acoustic communications.
Technical data
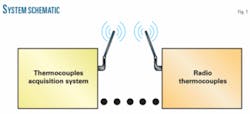
The radio thermocouples system has six temperature radio modem transmitters, one receiving apparatus, and one registration apparatus. The radio modem transmitters each use a digital thermometer capable of reading a 50° C. to 105° C. temperature range in 0.1° increments with 99.99% accuracy and an acquisition schedule governed by a PT 100 probe delivering four threads of 16-bit resolution. The thermometer feeds directly into a radio modem that converts the electrical signal into a digital signal and transmits it at 485 Mhz, using 750 milliwatts (Fig. 2). Sensor placement occurs at 1-km increments along the pipeline.
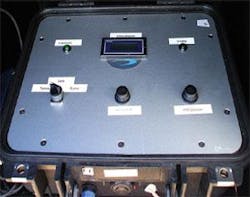
A steel box contains both the thermometer and the radio modem as well as a 12-v, 7 amp battery with a life of 10 days (Fig. 3). Battery use is limited to transmission, initiated by interrogation from the control unit and allowing a relatively long life. The radio signal is transmitted directly from this box to the receiving station. The box gathers information from the thermocouple every 2 sec.
The modem uses and RS 232 configuration to first store and then forward the information. Transmission occurs over a signal dedicated solely to that purpose and protected from outside interference, limiting the possibility of transmission-based data errors. Transmission can be as quick as every 5 sec.
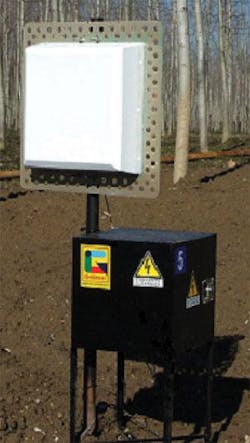
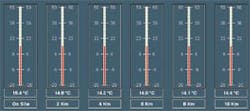
The receiving station moves data from the six thermocouples to a computer equipped with Scada Data Recon Digitron software. The software’s display allows the data to be observed during acquisition (Fig. 4), while a different aspect of the program stores and organizes the data for future analysis.
A separate schematic view shows the configuration and setting of each sensor as well as maximum and minimum values and a numerical view of the data itself during testing. Comparing these data to the digital pressure signal coming from the test head allows complete monitoring during hydrotesting of any variation in pressure as related to pipe temperature.
Field testing
Testing occurred on the 30-in. OD Mortara-Cosseria pipeline and the 48-in. OD Montalbano-Messina pipeline, operated by Snam Rete Gas SPA, Italy. Testing on the 30-in. line confirmed the system’s ability to deliver data accurately without having to gather it manually at each monitoring location. Testing on the 48-in. line showed the system to be capable of transmitting data across a maximum distance of 10 km.
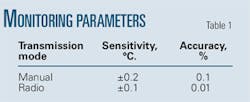
Operating the system in parallel to each pipeline’s existing manual system allowed data comparison. Table 1 shows the results of this comparison.
Real-time access to temperature data during hydrotesting increases the efficiency of the process, saving both time and money. The nearly continuous stream of data also allows more detailed analysis of test results.
The author
Carmelo Claudio Zanghì ([email protected]) is general hydrotest and control manager for Ghizzoni SPA and previously managed viscosity measurement at the refinery of Milazzo, Italy. He received a BS in physics and an MS in viscosity fluid behaviors at the University of Messina, Italy.
