Feed-gas molecular weight affects centrifugal compressor efficiency
A study has shown how relative density (molecular weight) affects the performance and efficiency of two centrifugal compressors.
Scenarios simulated included:
- Compressor speed as a function of molecular weight, while maintaining the same suction and discharge pressure and mass flow rate.
- Polytropic head and efficiencies as a function of gas molecular weight for a given compression ratio, and compressor speed.
- Effects of thermodynamic properties.
Compressors
Compressors generally fit into two categories:
- Positive displacement compressors that include reciprocating, rotary screw, sliding vane, liquid ring, and rotary lobe. The compression principle is volumetric displacement, in which reducing the gas volume increases pressure.
- Kinetic or dynamic compressors that include centrifugal and axial. The compression principle is acceleration and deceleration of gas, in which kinetic energy is converted to pressure increase. Reciprocating and centrifugal units are the most popular compressors used in oil and gas field production applications.
Rotary screw compressors have gained popularity for low to moderate-pressure gas boosting, refrigeration systems, and fuel-gas compression for gas turbines.
Power calculations
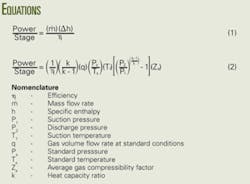
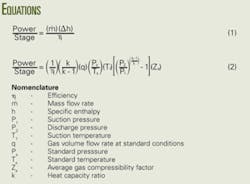
Theoretical power requirements are independent of compressor type, and actual power requirements vary with compressor efficiency. In general, Equations 1 and 2 in the equation box calculate power.
These two equations are equally correct theoretically. The practical choice depends on available data, although they are somewhat arbitrary. The power calculation should be made per stage of compression and then summed for all stages connected to a single driver. For general planning purposes, the graphical solutions in Reference 1 produce results comparable to these equations.
From a calculation viewpoint alone, the power calculation is sensitive to flow rate, inlet temperature and pressure, and outlet pressure. Gas composition is important but a small error in it is less important as long as it does not exclude corrosive components.
A compressor will operate under changing variables that affect its performance. The most difficult part of a compressor calculation, therefore, is to specify a reasonable range for each variable and not the calculation itself.
Maddox and Lilly emphasize that use of a single value for each variable is incorrect when evaluating a compression system.2
Normally, an evaluator will make thermodynamic calculations on an ideal (reversible) process and then adapt them to the real world by including an efficiency term.
A compression process has three ideal processes: isothermal, isentropic, a polytropic. Any of these processes can serve as a basis for evaluating compression power requirements by either hand or computer calculations. The isothermal process, however, seldom is the basis because the normal industrial compression process is not at constant temperature, even approximately.
The compression ratio has a limited practical range of between 2 and 6. The choice of the interstage pressure is an economic decision. One can estimate the pressure by equal compression ratios for each section and then adjust it to minimize total power requirement.
Equation of state
Any commercial process-flow simulation software contains an equation of state (EOS). Normally, these simulators use a cubic EOS such as Soave-Redlich-Kowng (SRK)3 or Peng-Robinson (PR)4 because of their simplicity and relative accuracy.
With proper binary interaction coefficients, these two equations give practically the same process simulation results.
Computer solution
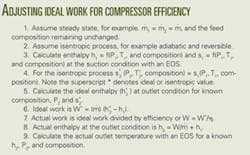
For a known gas rate, pressure (P1), temperature (T1), and composition at the inlet condition and discharge pressure (P2), the calculation with a computer of the compressor power requirement based on an EOS involves two steps:
- Determine the ideal or isentropic (reversible and adiabatic) enthalpy change of the compression process. The ideal work requirement equals mass rate multiplied by the isentropic enthalpy change.
- Adjust the ideal work requirement for compressor efficiency with the calculations based on an EOS as shown in the box.
Compressor efficiency, and hence, the compression process depends on the method used to evaluate the work requirement. Isentropic efficiency ranges from 0.60 to 0.90.
Computer simulations
This study used several HYSYS5 software simulations to show the effect of feed-gas molecular weight on centrifugal compressor performance.
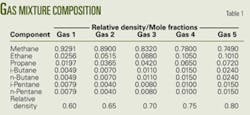
Table 1 lists the gas mixture compositions used in the simulations. The mixtures have molecular weights ranging from 17.38 to 23.17 kg/kmol (lbm/lbmole), corresponding to 0.60-0.80 relative densities.
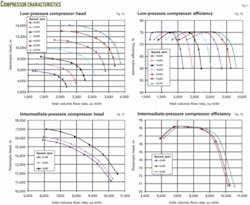
The simulations investigated two centrifugal compressors with compressor characteristics curves shown in Fig. 1. These curves were supplied to the simulation software.
Three cases were simulated:
- Low-pressure compressor with variable feed rate.
- Low-pressure compressor with variable speed.
- Intermediate-pressure compressor with variable feed.
Case 1
The low-pressure compressor with variable feed rate simulation used a 700-kPa fixed inlet pressure, 35º C. temperature, and 15,000-rpm speed and varied the feed-gas relative density from 0.60 to 0.80 in 0.05 increments.
To maintain the outlet pressure, the simulation needed to vary the feed flow rate.
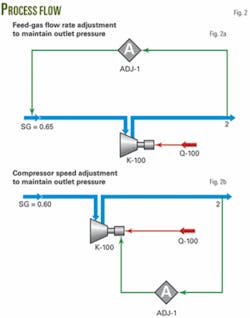
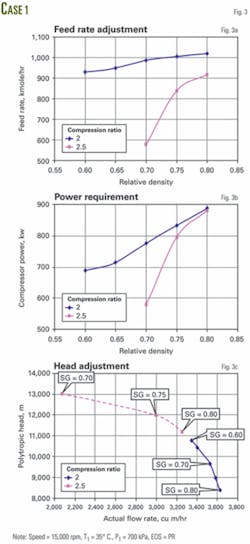
Fig. 2a shows the process flow diagram and Fig. 3 shows the simulation results for 2.0 and 2.5 compression ratios. The case used the PR EOS for calculating the thermodynamic properties.
Fig. 3a indicates that as the relative density decreases, the flow rate must decrease. Note, for the 2.5 compression ratio case, the simulation could not obtain convergence for 0.65 and 0.60 relative densities because the simulation had reached the surge limit.
For the same case, Fig. 3b shows the required power as a function of relative density. Because the flow rate decreases with decreasing relative density, the required power also decreases. This is consistent with Equations 1 and 2 because power is directly proportional to flow rate.
Fig. 3c shows the variation of polytropic head as a function of inlet actual volumetric flow rate. Note that this figure indicates the influence of relative densities on compressor performance.
Case 2
In the low-pressure compressor, variable-speed case, as in Case 1, for a fixed 700-kPa inlet pressure, 35º C., and mass flow rate of 1,000 kmol/hr, the simulation varied feed-gas relative density from 0.60 to 0.80 in 0.05 increments.
To maintain the outlet pressure, the simulation needed to vary compressor speed. Fig. 2b shows the process flow.
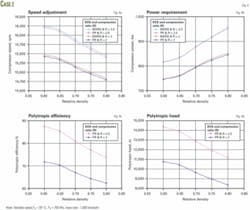
Figs. 4a-4b shows the simulation results for 2.0 and 2.5 compression ratios. In addition to the results with the PR EOS, the diagram also shows the results obtained with the Benedict-Webb-Rubin-Starling (BWRS) EOS.6
The difference in the results of these two EOS methods is negligible.
As shown in Fig. 4a, as the relative density increases, the compressor speed decreases. As relative density or molecular weight increased, however, the required power increased (Fig. 4b). This is also consistent with Equation 2 in which power is directly proportional to the average compressibility factor, and the compressibility factor, in turn, is proportional to the gas molecular weight. Figs. 4c and 4d show that polytropic efficiency and head decrease with relative density.
Case 3
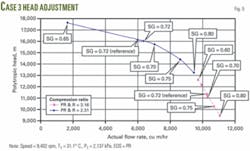
In the intermediate-pressure compressor, variable-feed rate case, as in Case 1, for a fixed 2,137-kPa inlet pressure, 31.1 C. , and 9,402 rpm, the simulation varied feed-gas relative density from 0.60 to 0.80 in 0.05 increments. To maintain the outlet pressure, the simulation varied the feed flow rate. Fig. 2a shows the process flow.
Fig. 5 shows the simulation results for 2.31 and 3.16 compression ratios. Note that for the 3.16 compression ratio and 0.60 relative density, the simulation could not converge because flow approached the surge limit. The reference point at 0.72 relative density in Fig 5 is from the compressor manufacturer’s actual test data. Note that the computer simulated results matched closely with the actual test data.
Results
A summary of the results is as follows:
- For the same feed condition, compression ratio, compressor speed, flow rates must be decreased as the relative density decreases.
- For the same feed condition, compression ratio, compressor speed, as the relative density increases, flow rates can be increased which results in more power consumption.
- For the same feed condition, compression ratio, compressor speed, as relative density decreases, flow rates must be decreased and will approach the surge limit.
- For the same feed condition and rate, and compression ratio, compressor speed decreases with molecular weight but as expected, the power requirement increases.
The PR EOS and BWRS EOS produced the same simulation results.
References
- Campbell, J.M., Gas Conditioning and Processing, Vol. 2, the Equipment Modules, 8th Edition; Norman, Okla.: Campbell Petroleum Series, 2001.
- Maddox, R.N., and Lilly, L.L., Gas Conditioning and Processing, Vol. 3: Advanced Techniques and Applications, 2nd Edition, Norman, Okla.: John M. Campbell & Co., 1990.
- Soave, G., “Equilibrium Constants from a Modified Redlich-Kwong Equation of State,” Chemical Engineering Science, Vol. 27, 1972, p. 1,197.
- Peng, Y.D., and Robinson, D.B., “A New Two-Constant Equation of State,” Ind. Eng. Chem. Fund., Vol. 15, No. 59, 1976.
- ASPENone, Engineering Suite, HYSYS Version 2006, Cambridge, Mass.: Aspen Technology Inc., 2006.
- Starling, K.E., and Powers, J.E.,“Enthalpy of mixtures by modified BWR equation,” Ind. Eng. Chem. Fundam., Vol. 9, No. 4, 1970, p. 531.
Based on a presentation to the Compressor & Turbines Optimization & Troubleshooting Conference, Aberdeen, Jan. 29-30, 2008.
The authors
Mahmood Moshfeghian ([email protected]) is a consultant and instructor at John M. Campbell & Co., Norman, Okla. Before joining JMC, he was professor of chemical engineering at Shiraz University, Iran, where he served as department head and associate dean of research in the college of engineering. He was previously professor of chemical engineering at the University of Qatar and a senior research scientist at the Kuwait Institute for Scientific Research. Moshfeghian holds BS, MS, and PhD degrees in chemical engineering from Oklahoma State University. He is a member of AIChE.
Larry L. Lilly ([email protected]) is past chairman of John M. Campbell & Co. He has more than 30 years’ experience with engineering and consulting companies including design, commissioning, and start-up. Lilly holds BS, MS, and PhD degrees in chemical engineering from Oklahoma State University. He is a member of AIChE, GPSA, GPA Europe, and numerous local technical societies.
Mark Bothamley ([email protected]) is chief engineer with John M. Campbell & Co. His experience covers design, operation, troubleshooting, and optimization of offshore and onshore oil and gas production and treating facilities. Before joining JMC, he was with BP PLC (Amoco) for 24 years in several locations worldwide. Bothamley holds a BS in chemical engineering from Lakehead University, Thunder Bay, Ont., and a diploma in natural gas and petroleum technology from the British Columbia Institute of Technology, Vancouver.
